Download
1 / 32
320 likes | 457 Vues
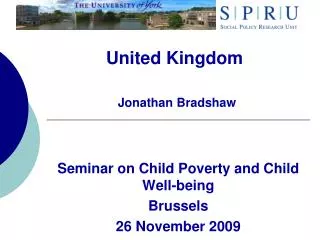
Measuring Child Poverty Jonathan Bradshaw and Gill Main. Second Peter Townsend Memorial Conference Measuring Poverty: The State of the Art University of Bristol 22 and 23 January 2011. State of child poverty is not good. No reduction in the UK since 2004/5 – 2010 target missed

E N D
Measuring Child Poverty Jonathan Bradshaw and Gill Main Second Peter Townsend Memorial ConferenceMeasuring Poverty: The State of the Art University of Bristol 22 and 23 January 2011
State of child poverty is not good • No reduction in the UK since 2004/5 – 2010 target missed • All but seven OECD countries increased their child poverty 1995-2005 • In EU 2005-2009 child poverty increased in swe, ger, fra, ita, gre and ire – flat in many others and higher than pensioner poverty in half • In developing world despite economic growth – child poverty flat lining.
Outline • Measurement of child poverty in the • UK • EU (and OECD) • Developing countries • Shift from income to deprivation • Shift from poverty to material well-being • Shift from material well-being to • Social exclusion • well-being • Asking children about poverty in The Children’s Society Survey • Pilot work for PSE 2010 on child deprivation
Flawed nature of much child poverty measurement • Household surveys (or registers) though some administrative stats in spatial analysis (ie ID) and international (SOWC) • Child the unit of analysis (only recently by WB) • Adult the informant • Mainly indirect - consumption/income • Arbitrary thresholds – • Too low in poor countries • ?Too high in rich countries • Equivalence scales with no scientific base • Usually relative
(Official) Child Poverty measurement in the UK • Relative low income = Equivalised net household income less than 60% median • 2020 target: <10% of children • Combined low income and material deprivation = Material deprivation >20% and equivalised net household income less than 70% median • 2020 target: <5% of children • ‘Absolute’ low income= Equivalised net household income falling below 60% of the ‘adjusted base amount’ • 2020 target: <5% of children • Persistent poverty= Equivalised net household income less than 60% of medianfor 3 years prior to current year • 2020 target: not yet set • +Frank Field
Child Poverty in the EU and rich nations • Sources: • OECD Growing unequal - every five years • Luxembourg Income Study - every five years • EU SILC now annually • EU social inclusion indicators from SILC – child poverty key focus • At risk of poverty rate<40,50,60,70% of national median • At risk of poverty gap 60% • <60% anchored • Lacking 3+ (out of 9) deprivation items • Persistent – to be developed • Now 2020 target =<60% median or lacking 4+ deprivation items or workless • SILC 2009 includes special module on child poverty/well-being • University of York work on extreme poverty recommends ‘consensual’ overlaps of deprivation and a budget standards income threshold • Relative income poverty thresholds too low in EU10
Developing world • World Bank dominates survey data and analysis • Child rarely the unit of analysis • Very low thresholds $x per day per capita completely arbitrary • Best work • Bristol method – lacking in one or more of seven domains • Mekonen Child Friendly Governments in Africa
Bristol method - Domains of child poverty • Severe Food Deprivation– children whose heights and weights for their age were more than -3 standard deviations below the median of the international reference population, i.e. severe anthropometric failure (Nandy et al, 2005). • Severe Water Deprivation - children who only had access to surface water (e.g. ponds, rivers or springs) for drinking or who lived in households where the nearest source of water was more than 15 minutes away. • Severe Deprivation of Sanitation Facilities – children who had no access to a toilet of any kind in the vicinity of their dwelling, including communal toilets or latrines. • Severe Health Deprivation – children who had not been immunised against any diseases or young children who had a recent illness causing diarrhoea or acute respiratory infection (ARI) and had not received any medical advice or treatment. • Severe Shelter Deprivation – children living in dwellings with five or more people per room (severe overcrowding) or with no flooring material (e.g. a mud floor). • Severe Education Deprivation – children aged between 7 and 18 who had never been to school and were not currently attending school (no fessional education of any kind). • Severe Information Deprivation – children aged between 3 and 18 in households which do not possess a radio, television, telephone or computer.
Child-friendly governments measure • “one which is making the maximum effort to meet its obligations to respect, protect and fulfil child rights to ensure child well-being” Mekonen, Y. Child Ind. Res. (2010) • Three dimensions based on indicators • Laws and policies • Allocation of resources • Child Outcomes: access to education, health, water, sanitation, survival, nutrition, poverty • Overall
From income to deprivation • Peter Townsend Poverty in the UK • Mack and Lansley Breadline Britain • PSE x 2 • Child deprivation index in PSE 1999 not very discriminating • Every item a necessity • Lacking 1 or more the threshold • Must do better this time
From income to social exclusion • Bristol SEM • Cabinet Office Social Exclusion Task Force Social Inclusion Over the Life Course • B-Semoperationalised for families with children (Oroyemi et al 2009). • Used data from the Families and Children Study (FaCS). • Eighteen markers of risk were constructed from the data, ranging from income poverty to lack of social contact to overcrowded accommodation. • They found that 45% of families with children were exposed to multiple risk markers (i.e. two or more markers of risk) in 2006, • less than 2 per cent experiencing 10 or more risks. • Cluster analysis was used to group families into nine relatively homogeneous ‘clusters’. :
From income poverty to material well-being • Material well-being combines • Income poverty • Rates and • Gaps • Deprivation • Parental worklessness
Overall child well-being versus material well-being (Bradshaw and Richardson 2009)
Correlations between matieral well-being and other domains in EU countries (Bradshaw and Richardson 2009)
IDACI correlated with other well being domains England (Bradshaw et al 2009)
Issues • How do children understand child poverty? • Can children be a useful data source in measuring child poverty? • How can child poverty be measured at the level of the child, rather than the family? • How useful are deprivation indicators in the measurement of child poverty?
Children’s perceptions of poverty: Ridge’s findings • the extent to which children seek to protect their parents from their own feelings of deprivation, sometimes including hunger • the extent to which they feel unable to invite their friends for meals or to stay • the importance of grandparents and other relatives in providing extras that mitigate the deprivation in their lives • the costs and inconvenience of public transport, particularly in rural areas, which restrict their lives • the value of holiday schemes that give children the chance to get away • the sense of shame and embarrassment when they are unable to dress like their peers and • their experience of schools as exclusionary – their inability to go on trips and outings, to contribute to school funds, to dress well and the frequent identification as ‘free dinner’ children.
Children’s Society Surveys of Child Subjective well-being (Rees et al 2009) • Asked • Number of workers • Free school meals • Pocket money • Very weak association with subjective well-being • Stronger with • Happiness with possessions 11 point scale • How well off do you think your family 5 point scale • Worry about reliability of responses • Ran focus groups with children asking them to identify socially perceived necessities • Then piloted them with 300 children and their parents
Items: Children’s Society survey • Short list • Pocket money • Money to save • Designer/brand name trainers • iPod/similar • Cable/satellite TV • Garden/similar • Car • Clothes to fit in • Holiday once a year • Day trips with family • Additional items • Treats/snacks • Being part of a club • Mobile phone • Computer and internet • Games console • Pet • Bedroom • Presents • Car • Clothes to fit in Answer codes: Have, don’t have, don’t have and don’t want
Results • 93.6% parent-child couples agreed on the number of adults in paid employment • 98.6% parent-child couples agreed on whether the child received free school meals • 50.7% parent-child couples agreed in their subjective assessment of the family’s wealth • For deprivation items, agreement varied between 82% (family day trips on a monthly basis) to 99% (computer with an internet connection at home) • Conclusion 11-16s can report material well-being
Associations with other poverty measures • The 20 item deprivation scale: • Moderate correlation with parental report on household income (r=0.4**) • No significant relationship with number of adults in paid work • Children not receiving free school meals owned on average 3.3 more items than those receiving free meals (t=2.7**) • Significantly associated with children’s perceptions of their family’s wealth (F=21.6**) • Scalability within acceptable range (Cronbach’s Alpha=0.86) • Shorter 10 item scale devised and tested with minimal change to Cronbach’s Alpha (0.82) • Adopted for survey of 5000 8-15 now in field
Conclusions from the pilot • Children’s reporting of objective poverty measures highly similar to parental reports, supporting further research with children as respondents. • Within deprivation items that children lacked, differences between parents and children tended to be in the form of parents reporting that children did not want an item whilst children reported that they did want it. • Support for the idea that children may conceptualise poverty differently to adults, or hide their experiences of poverty from parents.
PSE pilot work • Improve the socially perceived necessities items for children • Children’s Society work • Review of questions in other surveys
Items: PSE 2011 From PSE99 (items considered necessities and lacked by 3%+): • Celebrations on special occasions • Hobby or leisure activity • Educational games • Meat, fish or vegetarian equivalent at least twice a day • Bedroom for every child of different sex over 10 years • At least 4 pairs of trousers • Swimming at least once a month • Garden to play in • Some new, not second hand, clothes • Construction toys • Holiday away from home at least one week a year • Bike (new/second hand) • Leisure equipment • Friends round for tea/snack fortnightly For consideration from PSE99: • At least 50p a week for sweets (considered necessary by poorer parents) • Computer suitable for schoolwork (considered necessary by poorer parents, more universal now) • Computer games (more universal now) From FRS 2008-9 (higher proportion lacking than in 1999): • Play group at least once a week • School trip at least once a term
Items: PSE 2011 From EU SILC: • A suitable place to study or do homework • Access to all the GP/specialist treatment needed • Access to all the dental examinations/treatment needed From Children’s Society: • Pocket money • Money to save • Designer/brand name trainers • Treats/snacks once a week • Being part of a club • iPod/similar • Mobile phone • Computer and internet • Games console • Cable/satellite TV • Their own bedroom • Presents on special occasions • A family car • Access to public transport • Clothes to fit in with their peers • Books of their own • Day trips with their family once a month