Download
1 / 44
440 likes | 459 Vues
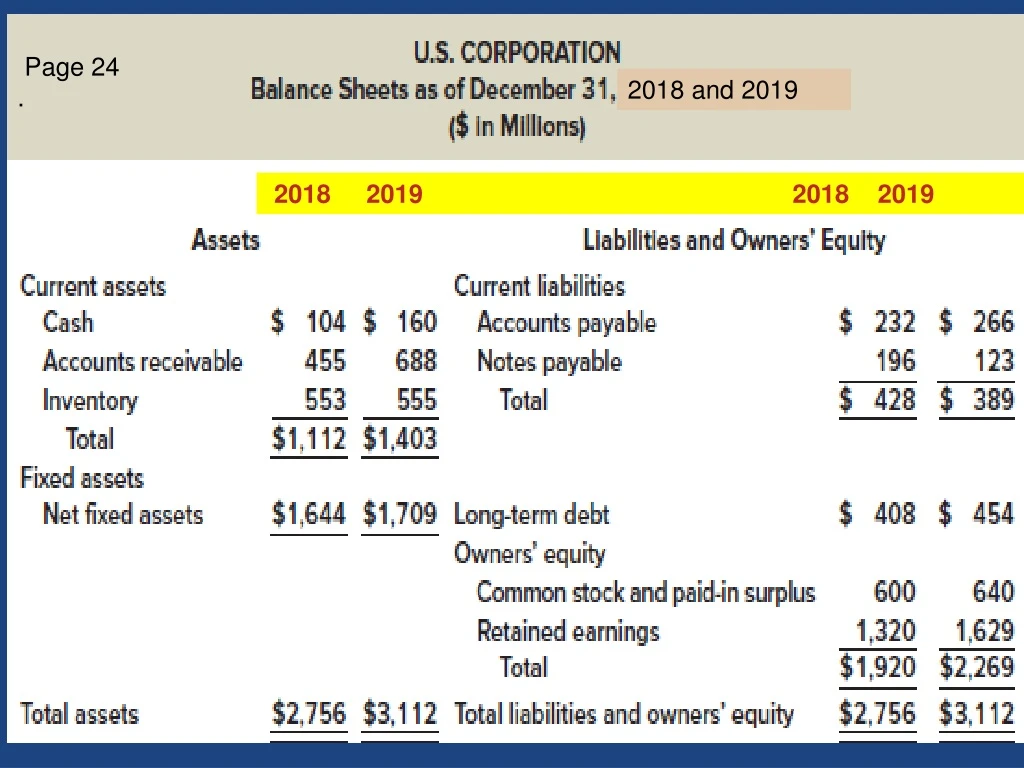
Page 24. 2018 and 2019. 2018 2019 2018 2019. Market vs . Book Value. The balance sheet provides the book value of the assets, liabilities, and equity.

E N D
Page 24 . 2018 and 2019 2018 2019 2018 2019
Marketvs. Book Value • The balance sheet provides the book value of the assets, liabilities, and equity. • Market valueis the price at which the assets, liabilities ,or equity can actually be bought or sold. • Market value and book value are often very different. Why? • Which is more important to the decision-making process?
Page 27 At Klingon Corp., shareholders' equity is actually worth almost twice as much as what is shown on the books. The distinction between book and market values is important precisely because book values can be so different from true economic values.
Income Statement • The income statement measures performance over a specified period of time (period, quarter, year). It is a flow or a video of the period. • Report revenues first and then deduct any expenses for the period • End result = Net Income = “Bottom Line” which goes to • Dividends paid to shareholders • Addition to retained earnings • Income Statement Equation: • Net Income = Revenue - Expenses
Page 27 2019 Top Line Bottom Line
Things to Consider when using Income Statements • GAAP Matching Principle: • Recognize revenue when it is fully earned • Match expenses required to generate revenue to the period of recognition • Noncash Items • Expenses charged against revenue that do not affect cash flow, especially Depreciation. • Time and Costs • Fixed or variable costs • Not obvious which is which on income statement • Earnings Management • Smoothing earnings • GAAP leaves “wiggle room”
Corporate Tax Rates in 2018 & 2019 • After the passage of the Tax Cuts and Jobs Act, on December 20th, 2017, the corporate tax rate has been changed to a flat 21% starting January 1st, 2018. The global average corporate tax rate is about 25%, so this move is designed to make the U.S. more globally competitive, effective January 1st, 2018 and beyond. • The Marginal & the Average tax rate is 21%. • The effective tax rate is lower still due to immediate expensing of capital equipment. • The system now is territorial versus worldwide, which also eliminates double taxation.
Financial Statements, Taxes, and Cash Flows Chapter 2 continued • Publicly traded companies must file regular reports with the Securities and Exchange Commission (SEC). • These reports are usually filed electronically and can be searched at the SEC public site called EDGAR. • http://www.sec.gov/edgar.shtml • http://www.sec.gov/edgar/searchedgar/companysearch.html • Look up Harley, for Harley-Davidson Corp. or HOG for its ticker
(From Quarterly Report, June 30, 2019 Notes to Financial Statements) Acquisition On March 4, 2019, the Company purchased certain assets and liabilities of StaCyc, Inc. for total consideration of $14.9 million including cash paid at acquisition of $7.0 million. StaCycproduces electric-powered two-wheelers specifically designed for children and supports the Company’s plans to expand its portfolio of electric two-wheeled vehicles. The Company has completed an allocation of the purchase consideration and valuation of acquired assets and liabilities. The primary assets acquired and included in the Motorcycles segment were goodwill of $9.5 million, which is tax deductible, and intangible assets of $5.3 million. https://www.youtube.com/watch?v=14HTIqYYOZE Video
Yahoo Finance Comparison of Competitors ttm = trailing twelve months, yoy is Year over Year, and PEG=PE/growth rate.
Direct and Indirect Taxes Marginal direct corporate tax rate is now 21% in the US on corporations from the first dollar. Canada’s highest marginal rate in 2019 is just 15%(due to rebates) and provincial taxes range from 11% to 15%, in all 26% to 30%. Mexico’s corporate tax rate is 30% Various States in the US also impose taxes from 1% to 12%. Indirect taxes, are taxes such as a value-added tax, that is levied on goods or services rather than individuals and is ultimately paid by consumers in the form of higher prices. In Europe, indirect taxes are far higher than in the US
Personal Tax Rates (2018-…)Table 2.3, Page 31 Corporate tax rates are 21%, so sole proprietorships earning less than $38,700 have lower taxes. But any sole proprietorships or partnerships earning more than 38,700 are better off incorporating.
The Concept of Cash Flow • Cash flow is one of the most important pieces of information that a financial manager can derive from financial statements • The statement of cash flows gives investing, operating and financing activities, but does not provide us with the same information that we are looking at here • We will look at how cash is generated from utilizing assets and how it is paid to those that finance the purchase of the assets
Brief Comments: Statement of Cash Flows It traces the flow of funds (or working capital) into and out of your business during an accounting period. • Beginning Cash • Add/Subtract Cash from Operating Activities • Add/Subtract Cash from Investing Activities • Add/Subtract Cash from Financing Activities • Ending Cash
Cash Flow From Assetsa.k.aFree Cash Flow • Cash Flow From Assets (CFFA) = Cash Flow to Creditors + Cash Flow to Stockholders • Cash Flow From Assets = Operating Cash Flow (OCF) –Net Capital Spending (NCS) – Changes in NWC
Dole Cola Example #1 Find CFFA using method 2. First find OCF.
Dole ColaFind Net Capital Spending & Change in Net Working Capital Page 39
Dole ColaCash Flow from Assets 2019 (CFFA) Negative free cash flow Negative free cash flow means that that the firm is NOT free to distribute to creditors and stockholders because everything is needed for working capital or fixed asset investments.
Try This Problem – Example #2 • Current Accounts • 2019: CA = 4,400; CL = 1,500 • 2018: CA = 3,500; CL = 1,200 • Fixed Assets and Depreciation • 2019: NFA = 3,400; 2018: NFA = 3,100 • Depreciation Expense = 400 • Long-term Debt and Equity (R.E. not given) • 2019: LTD = 4,000; Common stock & APIC = 400 • 2018: LTD = 3,950; Common stock & APIC = 400 • 2019 Income Statement • EBIT = 2,000; Taxes = 300 • Interest Expense = 350; Dividends = 500 Compute CFFA !
2 ways to solve for CFFA Method 2 • OCF = $2,000 + $400 – $300 = $2,100 • NCS = $ 3,400 – $3,100 + $400 = $700 • Changes in NWC = ($4,400 – $1,500) – ($3,500 – $1,200) = $600 • CFFA = $2,100 – $700 - $600 = $800 Alternatively with method 1: • CF to Creditors = $350 – ($4,000 – $3,950) = $300 • CF to Stockholders = $500 • CFFA = $300 + $500 = $800
Another Example #3: Balance Sheet and Income Statement Information • Current Accounts • 2019: CA = 3625; CL = 1787 • 2018: CA = 3596; CL = 2140 • Fixed Assets and Depreciation • 2019: NFA = 2194; 2018: NFA = 2261 • Depreciation Expense = 500 • Long-term Debt and Equity • 2019: LTD = 538; Common stock & APIC = 462 • 2018: LTD = 581; Common stock & APIC = 372 • Income Statement • EBIT = 1014; Taxes = 368 • Interest Expense = 93; Dividends = 285 Additional Paid in Capital FIND CFFA !
Cash Flow From Assets (2 ways) OCF = 1,014 + 500 – 368 = 1,146 OCF = EBIT + Dep - Taxes NCS = 2,194 – 2,261 + 500 = 433 NCS = Ending FA – Beginning FA + Dep Changes in NWC = (3,625 – 1,787) – (3,596 – 2,140) = (1,838) – (1,456) = 382 DNWC = Ending NWC – Beginning NWC CFFA = 1,146 – 433 – 382 = 331 • CF to Creditors = 93 – (538 – 581) = 93 + 43 = 136 CF to Creditors = Interest paid – Net new borrowing • CF to Stockholders = 285 – (462 – 372) = 285 -90 = 195 CF to Stockholders = Dividends paid – Net new equity raised CFFA = 136 + 195 = 331 The CF identity holds.
2018 and 2019 2018 2019 2018 2019 • US Corporation • Income Statement 2019 • Net Sales 1,509 • Cost of Goods Sold 750 • Depreciation 89 • Earnings before interest and taxes670 • Interest paid 70 • Taxable Income 600 • Taxes (21%) 126 • Net income $474 • Dividends $165 • Additions to retained earnings 309
Example #4 - Two Methods CFFA (method 1 US Corp.) • CF to creditors= interest paid – net new borrowing = 70 – 46 = 24 • Interest paid is on the income statement = 70 • Change in LTD = 454 – 408 = 46 • CF to stockholders= dividends – net new equity raised = 165 – 40 = 125 • Dividends is found on the income statement • Change in equity = 640 – 600 = 40 • CFFA = sum of these = 24 + 125= $149
CFFA (method 2 – my preferred method) CFFA = OCF – NCS - ΔNWC OCF = EBIT + depreciation – taxes = $670 + 89 – 126 = $633 NCS = ending net FA– beginning net FA + depreciation = $1709 – 1644 + 89 = $154 ΔNWC = ending NWC – beginning NWC = ($1403 – 389) – ($1112 – 428) = $330 Therefore: CFFA = 633 – 154 – 330 = $149 positive free cash flow.
Working with Financial StatementsChapter 3 • Financial ratios vary widely across firms and industries. For example, P/E ratios. • What is the ‘right’ P/E ratio for a firm? Is this a good or bad number? • What do we learn by comparing financial ratios of different firms? • How to standardize financial statements for comparison purposes • The determinants of a firm’s profitability and growth • Understand the benefits, problems, and pitfalls in financial statement analysis
Standardized Financial Statementseasier to compare firms and years • Common-Size Balance Sheets All accounts = percent of total assets (%TA) • Common-Size Income Statements All line items = percent of sales or revenue (% Sales) • Standardized statements are useful for: • Comparing financial information year-to-year • Comparing companies of different sizes, particularly within the same industry
Given in $ 2018 and 2019 2018 2019 http://www.bartleby.com/198/1.html The Love Song of J. Alfred Prufrock By T.S. Eliot (1914) An American in London just before WW1. First modernist poem of dreary cities, fear, war, and boredom. 8 Minute YouTube: https://www.youtube.com/watch?v=JAO3QTU4PzY
2018 and 2019 2018 2019 Given in % of Total Assets
Given as % of Sales Tells us what happened to each dollar of sales. N.I./Sales = 20.1% = Profit Margin
Ratio Analysis • Allows for better comparison through time or between companies • Used both internally and externally • For each ratio, ask yourself: • What the ratio is trying to measure? • Why is that information important?
Categories of Financial Ratios • Liquidity ratios or Short-term solvency • Financial leverage ratios or Long-term solvency ratios • Asset management (Inventory, Receivables, and Asset Turnover ratios) • Profitability ratios • Market value ratios
Liquidity Ratios • Current Ratio = CA / CL • 708 / 548 = 1.29 times • Quick Ratio= (CA – Inventory) / CL • Also called the Acid Test Ratio • (708 - 422) / 548 = 0.52 times • Cash Ratio = Cash / CL • 98 / 548 = .18 times
Financial Leverage Ratios • Total Debt Ratio= TD / TA = (TA – TE) / TA • (3,630 - 2,625) / 3,630 = 0.28 times • Debt/Equity = TD / TE Note: 548+457=1,005 • (0.28 / 0.72) = 0.38 times or 1,005 / 2,625 = .38 • Equity Multiplier = TA / TE = 1 + D/E • ($1 / 0.72) = 1.38 or 3,630 / 2,625 = 1.38 EM
Financial Leverage Ratios • Times Interest Earned = EBIT / Interest 741 / 141 = 5.26 times • Cash Coverage = (EBIT + Depreciation) / Interest (741 + 276) / 141 = 7.21 times • EBITD is much larger than interest, so interest is easily covered Note: What is EBITDA? + Amortization of goodwill The EBITDA Song https://www.youtube.com/watch?v=Ck3pfC4m5hE
Asset Management: Inventory Ratios • Inventory Turnover= COGS / Inventory • 1344 / 422 = 3.18 times • Days’ Sales in Inventory = 365 / Inventory Turnover • 365 / 3.18 = 114.61 days
Asset Management: Receivables Ratios • Receivables Turnover= Sales / AR • 2361 / 188 = 12.56 times • Days’ Sales in Receivables = 365 / Receivables Turnover • 365 / 12.56 = 29.06 days
Asset Management: Asset Turnover Ratios • Total Asset Turnover = Sales / Total Assets • 2,361 / 3,630 = 0.65 times • Capital Intensity Ratio = 1/TAT • 1 / 0.65 = 1.54 as this rises, greater need for assets to generate sales. TAT
Profitability Measures • Profit Margin = NI / Sales • 474 / 2,361 = 20.08% abbreviated PM • Return on Assets (ROA) = NI / TA • 474 / 3,630 = 13.06% • Return on Equity (ROE) = NI / TE • 474 / 2,630 = 18.06% Note: ROA ≤ ROE All 3 are Important.
Market Value Measures • Market Price = $115 per share = PPS • Shares outstanding = 33 million • Earnings per Share = EPS = 474/ 33 = $14.36 • PE Ratio= PPS / EPS • $115 / $14.36 = 8.01 times • Price/Sales Ratio = PPS/Sales per share • $115 / ($2,361/33) = 115/ 71.55 = 1.61 • Market-to-book ratio = PPS / Book value per share • Book value per share = Total Equity/shares outstanding = $2,630 / 33 = $79.55 • Market-to-Book = $115 / 79.55 = 1.45 times • Enterprise Value = Market value of stock – book value of liabilities – Cash • EBITDA Ratio = Enterprise Value / EBITDA