Download

1 / 45
450 likes | 470 Vues
This report discusses the goals, trends, and impact of educational attainment on economic prosperity in Virginia. It highlights demographic trends, the need for attainment, and strategies to reach the state's goals. The report also explores the economic and societal benefits of postsecondary education and the regional and racial disparities in educational attainment.

E N D
Educational Attainment and Economic Prosperity Educational Attainment & Economic Prosperity November 14, 2018
Agenda • State Goals & Trends • Demographic Trends • Understanding the Need and Impact of Attainment • Reaching the Goal • Benefits of Postsecondary Attainment • Economic • Societal Benefits • Reaching the Goal
Goals • The Virginia Plan for Higher Education: Be the best-educated state by 2030 • 70 percent of adults with high quality credential or degree, 1.5 million awards • What are the goals/priorities? • Access/affordability • Student success and completion • Traditionally underserved populations • Innovation and efficiency • Workforce needs/economic development/Research
Overall population change is increasing about the same as the national average, but there are differences across age, racial/ethnic groups, and regions Source: American Community Survey Data, 2016
While younger aged Virginians make up the largest proportion of total residents, seniors and older workers represent fastest growing population
And Hispanic residents represent the fastest growing demographic population Source: American Community Survey Data, 2016
While Virginia is among the top 10 States in levels of attainment…
…Within these total figures, there are stark differences in educational attainment among different populations. Virginia’s Black, Hispanic and Native American populations are on average ~20 points behind the White majority population.
There are also significant regional disparities across the state Regional Disparities Falls Church City 84.5% Sussex – 12.1% Listing by locality provided in appendix Source: Lumina Foundation http://strongernation.luminafoundation.org/report/2017/#nation Source: Lumina Foundation
There are differences in the rates of working age populations with some college, but no degree by race.
Economic Impact Educational attainment data are a key component to many state rankings (Best State for Business, Best State to Live and Raise a Family) A one point increase in the percentage of postsecondary educated people lifts their wages 1.5%, and the earning of other citizens by 1.1% A one point increase in the percentage of people with post-secondary degrees and credentials increases overall economic growth over ten years by one–half percentage point
Individuals with postsecondary credentials typically earn higher income and are more likely to be employed Source: American Community Survey Data, 2016
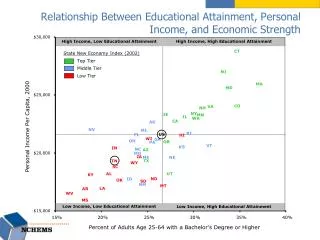
Attainment ImpactsIncome EDUCATIONAL ATTAINMENT AND PERSONAL INCOME, BY VIRGINIA REGION,2010-2014 Percentage of Population with aBachelor’s Degree orBetter 11.1% to 15% 15.1% to20% 20.1% to25% Northern $65,296 Eastern $40,781 25.1% to30% 30.1% to35% 35% orhigher Valley $38,056 Central $48,044 WestCentral $37,808 Southwest $32,561 Southside $32,160 Hampton Roads $44,790 Prepared by the Council on Virginia’s Future,2017, Using the nine cultural regions designated for its work. 15
Societal Benefits Notes: Public Assistance = any public assistance in past 22 months Supplementary Security Income = Social Security for those with disabilities preventing them from working, and their dependents in past 22 months Source: American Community Survey Data, 2016
Benefits to the Commonwealth Source: It’s Not Just the Money, Lumina Foundation https://www.luminafoundation.org/resources/its-not-just-the-money
Benefit to Individuals & Communities Individuals with an associate degree or higher are….. 38% more likely to have health benefits 79% more likely to volunteer 30%more likely to vote in an election …than individuals with a high school diploma Source: It’s Not Just the Money, Lumina Foundation https://www.luminafoundation.org/resources/its-not-just-the-money
By 2020, 67% of jobs in Virginia will require postsecondary education Source: Georgetown Center on Education and the Workforce, Projections of Jobs through 2020, https://cew.georgetown.edu/cew-reports/recovery-job-growth-and-education-requirements-through-2020/
Virginia Compared to the Nation and Other States • Virginia’s educational attainment rate ranks 6th in the nation for working-aged adults • However, Virginia’s educational attainment rate ranks 11th for its younger population (ages 25 – 34) Note: Certificate and credential data based on estimates developed by Georgetown Center on Education and Workforce Source: Lumina Foundation http://strongernation.luminafoundation.org/report/2017/#nation
Younger Cohort FallingBehindGlobal Competition: Where We AreNow Educational Attainment (Bachelor’s and Above) of Virginia and Key Competitors,2015 Ages 25 to 34 Ages 25 to64 80% 70% 60% 50% 40% 30% 20% 10% 0% Virginia Massachusetts Maryland Korea Canada Japan UK France US SOURCE: Country Data - Organisation for Economic Co-operation and Development, Education at a Glance, 2016/ State Data – SCHEV staff analysis of US Census and Lumina foundationdata NOTE: State data represents 2014 while country data shows 2015data. 6 Prepared by the Council on Virginia’s Future,2017
Virginia’s Educational Attainment by Age Group Educational attainment rates vary by age. 35-44 year olds have the highest percentage of postsecondary degrees. This could shift in the coming years as more individuals ages 25-34 earn a degree. Virginia’s Educational Attainment Rates by Age and Type Some college Associate Bachelor’s Graduate or professional degree Source: American Community Survey, 2015 1-year Estimates, B15001.
Number of High School Graduates is RelativelyFlat Source: Western Interstate Commission for Higher Education, Knocking at the College Door: Projections of High School Graduates, 2016.knocking.wiche.edu * Total is the sum of Public School graduations and does not include Private School graduations, which data was not available in a disaggregated form. A table that includes Private School totals is included in the appendix. The Public Schools Total will not exactly equal the sum of the races/ethnicities columns, which are projected separately. Academic Year refers to the K-12 calendar running fall to spring and may include graduates from any point in that school year, including the summer after the year end.
Of 100 high school graduates in VA . . . 72 students in 2015 enrolled within 16 months at a: • 4-year public, • 4-year private, or • 2-year institution Little change in the percentage of HS graduates enrolling Enrollment in postsecondary remained between 71-72% from 2008 to 2015 Source: Virginia Department of Education. Postsecondary enrollment report https://p1pe.doe.virginia.gov/postsec_public/postsec.do?dowhat=LOAD_REPORT_C11
Percentage of 2015 HS Graduates Going to College Source: Virginia Department of Education. Postsecondary enrollment report https://p1pe.doe.virginia.gov/postsec_public/postsec.do?dowhat=LOAD_REPORT_C11
School Divisions w/ Lowest Percent of HS Graduates Enrolled in College
School Divisions w/ Greatest Number of HS Graduates Attending College
HS Graduate College Enrollment Trends by Race White/ 2 or more races Black Hispanic Hispanic Source: Virginia Department of Education. Postsecondary enrollment report https://p1pe.doe.virginia.gov/postsec_public/postsec.do?dowhat=LOAD_REPORT_C11
Where Did 2015 HS Graduates Go to College? Percent of Graduates Enrolling by Institution Type 4-year private 2-year 4-year public Source: Virginia Department of Education. Postsecondary enrollment report https://p1pe.doe.virginia.gov/postsec_public/postsec.do?dowhat=LOAD_REPORT_C11
Pell Undergraduate Enrollment Distribution 2016-17 Source: All students http://research.schev.edu//fair/pell_trend_report.asp
Pell Undergraduate Enrollment Trends Percent of Total Enrollments by Institution Type Public 2-year Public 4-year Source: http://research.schev.edu//fair/pell_trend_report.asp
Virginia Plan Measure: Success Target: Annually improve completion rates that close the gap between underrepresented populations and traditional students by 2030 Completion/Success Index for Public Institutions Non-underrepresented populations Underrepresented populations Note: Underrepresented populations include those who are minority race/ethnicity, students ages 25 and older, low-income or from areas of the state in the lowest quintile for postsecondary attainment. Completion is measured by the student success index which includes students who graduate or remain enrolled at any Virginia institution within the measurement timeframe. The Student Success index is a broader measure than traditional graduation rates as it includes all students, including full-time, part-time, transfer and first-time in college students. In addition, success is counted by students who either graduate at their institution or another institution or remain enrolled after the measurement period. Source: http://research.schev.edu/gradrates/success_index.asp2011-12 for 4-year/2013-14 for 2-year within 100% time frame
6-year graduation rates by income are improving, but gaps remain largely the same Source: http://research.schev.edu//gradrates/CHL_EconTrendsHeac.asp
Attainment Rates in Rural Virginia • Educational attainment in the Commonwealth’s “rural horseshoe” lags the remainder of the state • If the rural horseshoe were its own state of nearly 2.1 million residents, it would be tied with Arkansas at 50th and ranked between Mississippi and West Virginia with only 19% of its residents holding a bachelor’s degree or higher – and 19% of adults fail to graduate high school • Nearly 1 in 3 adults are not in the workforce in Southside and Southwest Virginia Source: Virginia Community Colleges, Rural Virginia Horseshoe Initiative
Individuals with Credits Earned and No Degree at a VA Public or Private, Nonprofit Institution Source: SCHEV research Notes: Credits--Virginians Enrolled in Public and Nonprofit Private Colleges between 1992-93 and 2012-2013 who Passed at Least One Class with a "D" or Better. Earnings—Earnings are based on years 2011, 2012, 2013, 2014, or 2015
Virginia Plan Measure: Awards Target: Grant 1.5 million undergraduate degrees and workforce credentials by 2030, including those that close the gap in unfilled jobs Actual and Projected Cumulative Awards to reach 1.5 million Target by 2030 Projections Actuals Source: Commonwealth Degree, Certificate Completion Scorecard http://research.schev.edu/completions/completion_scorecard.asp
StrategyLabs.LuminaFoundation.org Strategy Labs
Virginia Attainment Rates by County and Independent City Source: Lumina Foundation
Virginia Attainment Rates by County and Independent City Source: Lumina Foundation
Virginia High School Graduations Source: www.knocking.wiche.edu
Virginia High School Graduations Source: www.knocking.wiche.edu