Download
1 / 37
370 likes | 413 Vues
Explore the functionalities of Geographic Information Systems (GIS) in processing, analyzing, and displaying spatial data for decision-making purposes. Learn about GIS components, spatial relationships, data formats (Raster and Vector), and their applications in various sectors. Gain insights on GIS software capabilities and the differences between raster and vector formats. Discover the significance of GIS in managing geographical information effectively and integrating different data types within a unified system.

E N D
What is a Geographic Information System (GIS)? • A GIS is a particular form of Information System applied to geographical data. • An Information System is a set of processes, executed on raw data to produce information which will be useful when making decisions. • A system is a group of connected entities and activities which interact for a common purpose. This discussion is derived from a seminar by Dr. David Waits
What is a Geographic Information System (GIS)? • An information system has a full range of functions to: • process observations • process measurements • provide descriptions • explain data • make forecasts • make decisions
What is a Geographic Information System (GIS)? • In a geographic information system, information is characterized spatially. • In a GIS the common purpose is decision making to manage: • land • resources • transportation • retailing • OR any other spatially distributed activity
What is a Geographic Information System (GIS)? • A GIS is an organized collection of computer hardware, software, geographic data, and personnel to efficiently capture, store, update, manipulate, analyze, and display all forms of geographically referenced information. • A GIS integrates spatial and other kinds of information within a single system to provide a consistent framework for analyzing geographic (spatial) data.
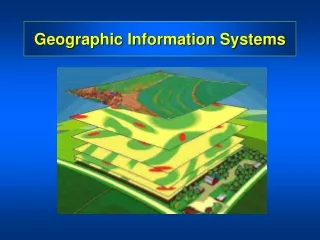
What is a Geographic Information System (GIS)? • A GIS makes connections between activities based on geographic proximity. • The digital data structure can be conceptualized as a set of “floating electronic maps” with a common registration allowing the used to “look” down (drill down) and across the stack of maps.
What is a Geographic Information System (GIS)? • The spatial relationships can be summarized (data base inquiries) or manipulated (analytical processing). • Another definition of GIS - An internally referenced, automated, spatial information system for data mapping, management, and analysis
CaptureData RegisterMap Base Store Datain Computer InterpretData Convert Datato DigitalFormat ProcessData DisplayResults GIS Process
Images ImageProcessingSystem StatisticalReports Maps Map DigitizingSystem Statistical Analysis System SpatialDataBase AttributeDataBase DatabaseManagementSystem Geographic Analysis System StatisticsTabular Data CartographicDisplay System Maps GIS System
Geographic Information System GIS - Map Stacking NDVI From Aerial Image Nitrogen Availability Estimate from Aerial Photo pH Layer Courtesy of PPI
“Drilling Down” Through The Data Layers Courtesy of PPI
GIS Data Formats • There are two formats used by GIS systems to store and retrieve geographical data: • Raster • Vector
Raster Format • Data are divided into cell, pixels, or elements • Cells are organized in arrays • Each cell has a single value • Row and Column Numbers are used to identify the location of the cell within the array. • Perhaps the most common example of raster data is a digital image.
Vector Format • Data are associated with points, lines, or boundaries enclosing areas • Points are located by coordinates • Lines are described by a series of connecting vectors (line segments described by the coordinates of the start of the vector, its direction, and magnitude or length). • Areas or polygons are described by a series of vectors enclosing the area.
Vector Format • Any number of factors or attributes can be associated with a point, line, or polygon. • Data are stored in two files: • a file containing location information • a file containing information on the attributes • A third file contains information needed to link positional data with their attributes.
GIS VectorFormat GIS RasterFormat Map Feature (X,Y)Coordinate in space Cell Locatedin an Array Vector and Raster Representation of Point Map Features
GIS VectorFormat GIS RasterFormat Map Feature Vector and Raster Representation of Line Map Features
GIS VectorFormat GIS RasterFormat Map Feature Vector and Raster Representation of Area Map Features
Vector and Raster Formats • Most GIS software can display both vector and raster data. • Most GIS software can display both raster and vector data. Only a limited number of programs can analyze both types of data or make raster type analyses in vector formats. • “Low end” software may display only raster format and be useful only for creating maps.
Raster formats are efficient when comparing information among arrays with the same cell size. Raster files are generally very large because each cell occupies a separate line of data, only one attribute can be assigned to each cell, and cell sizes are relatively small. Vector formats are efficient when comparing information whose geographical shapes and sizes are different. Vector files are much smaller because a relatively small number of vectors can precisely describe large areas and a many attributes can be ascribed to these areas. Comparison of Raster and Vector Formats Raster Vector
Raster representations tend to be relatively coarse and imprecise Vector representations of shapes can be very precise. Comparison of Raster and Vector Formats Raster Vector
Coordinate Systems • Spatial data are generally recorded as latitude and longitude, frequently as decimal degrees. • Other systems commonly used are the Universal Transverse Mercatur (UTM) and State Plane Coordinates. These systems are projections of the curved surface of the globe on to a plane surface.
Coordinate Systems • In UTM, the preferred system, the distance unit is the meter. • The unit of the state plane system is the foot. • There is generally a different coordinate system for each state in the state plane system. • In the UTM system, projections are made in zones of approximately 6 degrees of longitude.
Coordinate Systems • There are two datums (reference planes) commonly used to make projections: North American Datum of 1927 (NAD27) and the World Geographic Reference System of 1984 (WGS84). The WGS84 datum can be used world wide. The default datum of many GPS receivers is the WGS84 datum.
UTM Specifications • UTM position is specified by: • Number of the Zone • North (or South) of the equator • East and West of the central meridian of the zone • Distances are in meters • Coordinates are referred to as “Northings”, “Eastings”, etc. • N xxxxxx, E yyyyyy
Interpolation to Predict Missing Data • Frequently, data are collected at discrete points located a significant distance apart or some of the data are missing. • Interpolation is used to predict the values of the missing data. • There a number of interpolation algorithms available in SST Toolbox and other software.
Interpolation Algorithms • Nearest neighbor • Local Averaging • Inverse distance to a power • Radial bias functions • Shepard’s Method • Kriging AND • Simple Contouring
What is the effect of the interpolation algorithm on the estimate of missing data? Efaw 1 x 1 Experiment - Phosphorus “Missing” Data
Nearest Neighbor • Value of the nearest measurement to the missing data. • In the case of values at the same distance, the average of those values Missing Data Nearest Neighbor
Local Average • Average of all values within a predetermined distance. Missing Data Averaged Values
Inverse (Weighted) Distance • Values are weighted by the inverse of their distance from the missing value. The weights can be raised to a power. The interpolated value is equal to the sum of the weighted values divided by the sum of the weights. Search Radius < 3 ft Missing Data
W = 1W = 0.707W = 0.5W = 0.447W = 0.354 Inverse (Weighted) Distance Missing Data
Prediction by Linear interpolation Between Every Fifth Data PointEfaw 1 by Experiment