Download
1 / 83
830 likes | 867 Vues
Explore new product decision models and market forecasting techniques with focus on understanding customer preferences through conjoint analysis. Learn the value of customer value assessment in product design and tradeoff evaluation.

E N D
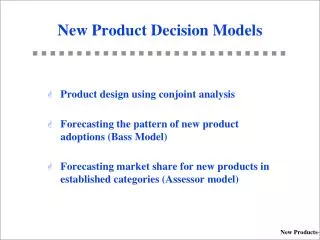
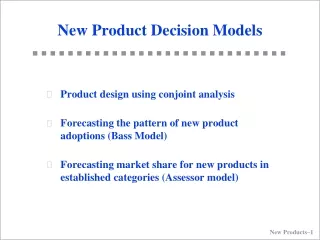
New Product Decision Models • Product design using conjoint analysis • Forecasting the pattern of new product adoptions (Bass Model) • Forecasting market share for new products in established categories (Assessor model)
“Newness” of Products • Repositioning • Breakthroughs—Major Product Modifications New to World • Line Extensions • “Me Too” Products New to Company
New Products as Part of Corporate Strategy Markets Existing New Market Penetration Market Development Existing Products New Product Development New (Diversification)
Opportunity Identification Market definitionIdea generation Life-Cycle Management Market response analysis & fine tuning the marketing mix; Competitor monitoring & defenseInnovation at maturity Introduction Launch planningTracking the launch Go No Testing Advertising & product testingPretest & prelaunch forecastingTest marketing The New Product Development Process Reposition Harvest Go No Design Identifying customer needs Sales forecasting Product positioning Engineering Marketing mix assessment Segmentation Go No Go No
Based on a study of 203 products in B2B -- Robert G. Cooper, Winning at New Products (1993) . Success measured using four factors: (1) whether it met or exceeded management’s criteria for success, (2) the profitability level (1-10 scale), (3) market share at the end of three years, and (4) whether it met company sales and profit objectives (1-10 scale). New Products–5
Source: Robert G. Cooper, Winning at New Products (1993) New Products–6
Source: Robert G. Cooper, Winning at New Products (1993) New Products–7
Source: Robert G. Cooper (1993) New Products–8
Value of Good Design 80% of a product’s manufacturing costs are incurred during the first 20% of its design (varies with product category). Conjoint Analysis is a systematic approach for matching product design with the needs and wants of customers, especially in the early stages of the New Product Development process. Source: Mckinsey & Company Report
What is Conjoint Analysis? A way to understand and incorporate the structure of customer preferences into the new product design process. In particular, it enables one to evaluate how customers make tradeoffs between various product attributes. • The basic output of conjoint analysis are: • A numerical assessment of the relative importance that customers attach to attributes of a product category • The value (utility) provided to customers by each potential feature of a product
Customer Value Customer Value Assessment Procedures • Inferential/Value-Based • Internal engineering assessment • Indirect survey questions • Field value-in-use assessment • Behavior-Based • Choice models • Neural networks • Discriminant analysis Attitude-Based • Indirect/(Decompositional Methods) • Conjoint analysis • Preference Regression Direct Questions • Unconstrained • Focus groups • Direct survey questions • Importance and attitude ratings • rule-based system/AI/expert systems • Constrained/Compositional Methods • Multiattribute value analysis • Benchmarking
Why is Customer Value Assessment through Conjoint Useful? • Design new products that enhance customer value. • Forecast sales/market share/profit of alternative product concepts. • Identify market segments for which a given concept offers high value. • Identify the “best” concept for a target segment. • Explore impact of alternative pricing and service strategies. • Help production planning in flexible manufacturing systems.
Conjoint Analysis in Product Design Should we offer our business travelers more room space or a fax machine in their room? Given a target cost for a product, should we enhance product reliability or its performance? Should we use a steel or aluminum casing to increase customer preference for the new equipment?
Measuring Importance of Attributes When choosing a restaurant, how important is… Circle one Not Very Important Important Price 1 2 3 4 5 6 7 8 9 Quality of Food 1 2 3 4 5 6 7 8 9 Location 1 2 3 4 5 6 7 8 9 Decor 1 2 3 4 5 6 7 8 9
How to Use in Design/Tradeoff Evaluation • Example: Italian vs Thai = 20 – 16 = 4 util units $10 vs $15 = 22 – 14 = 8 util units • So “Italian”is worth $2.50 more than “Thai” for this customer: ÞCan use to obtain value to customer of service (non-price) attributes.
Conjoint Study Process Stage 1—Design the conjoint study: Step 1.1: Select attributes relevant to the product or service category, Step 1.2: Select levels for each attribute, and Step 1.3: Develop the product bundles to be evaluated. Stage 2—Obtain data from a sample of respondents: Step 2.1: Design a data-collection procedure, and Step 2.2: Select a computation method for obtaining part-worth functions. Stage 3—Evaluate product design options: Step 3.1: Segment customers based on their part-worth functions, Step 3.2: Design market simulations, and Step 3.3: Select choice rule.
An Example to Illustrate the Concepts of Conjoint Analysis: Designing a Frozen Pizza Attributes G Type of crust (3 types) G Topping (4 varieties) G Type of cheese (3 types) G Amount of cheese (3 levels) G Price (3 levels) Crust Type of Cheese Price Pan Romano $ 9.99 Thin Mixed cheese $ 8.99 Thick Mozzeralla $ 7.99 Topping Amount of Cheese Pineapple 2 oz. Veggie 4 oz. Sausage 6 oz. Pepperoni A total of 324 (3 ´ 4 ´ 3 ´ 3 ´ 3) different pizzas can be developed from these options!
Designing a Frozen Pizza:A More Complete Design Attributes G Type of crust (3) GAmount of meat (3) G Types of peppers (3) G Type of cheese (3) G Type of sauce (3) G Presence of olives (2) G Amount of cheese (3) G Amount of sauce (3) G Presence of oil (2) G Type of meat (3) G Presence of mushrooms (2) G Price (3) Prototypes 81 prototype pizzas from 105,000 possible profiles. Person Attributes G Sex G Household size G Category usage G Age G Favorite brand G Region G Presence of teenagers Study Approach G Each respondent rates 3 of the 81 prototypes along with a “control”. G Likelihood of purchase, conditioned on price. G Appropriateness for various meals/snacks. G Appropriateness for various family members.
Example Paired Comparison Aloha Meat-lover’s Special treat Crust Pan Thick Topping Pineapple Pepperoni Type of cheese Mozzarella Mixed cheese Amount of cheese 4 oz 6 oz Price $8.99 $9.99 Which do you prefer? Which one would you buy?
Example Ratings Product ExampleBundle Type of Amount PreferenceN umber Crust Topping Cheese of Cheese Price Score 1 Pan Pineapple Romano 2 oz $9.99 0 2 Thin Pineapple Mixed 6 oz $8.99 43 3 Thick Pineapple Mozzarella 4 oz $8.99 53 4 Thin Pineapple Mixed 4 oz $7.99 56 5 Pan Veggie Mixed 4 oz $8.99 41 6 Thin Veggie Romano 4 oz $7.99 63 7 Thick Veggie Mixed 6 oz $9.99 38 8 Thin Veggie Mozzarella 2 oz $8.99 53 9 Thick Pepperoni Mozzarella 6 oz $7.99 68 10 Thin Pepperoni Mixed 2 oz $8.99 46 11 Pan Pepperoni Romano 4 oz $8.99 80 12 Thin Pepperoni Mixed 4 oz $9.99 58 13 Pan Sausage Mixed 4 oz $8.99 61 14 Thin Sausage Mozzarella 4 oz $9.99 57 15 Thick Sausage Mixed 2 oz $7.99 83 16 Thin Sausage Romano 6 oz $8.99 70
Conjoint Computations mki U(P) = å å aij xij i=1 j=1 where: P = a particular product/concept of interest, U(P) = the utility associated with product P, aij = Utility associated with the jth level (j = 1, 2, 3, . . . , ki) on the ith attribute (part-worth), ki = number of levels of attribute i, m = number of attributes, and xij = 1 if the jth level of the ith attribute is present in product P,0 otherwise. {
Define the competitive set -- these are the products from which the target segment make choices. Some of theses may be existing products and, others concepts being evaluated. We denote this set of products as P1, P2,...PN. Select Choice rule Maximum utility rule Share of preference rule Logit choice rule Alpha rule Software also has a “Revenue index option” wherein you can compute the revenue index of any product compared to the revenue index of 100 for a base product you select. Market Share and Revenue Share Forecasts
Market Share Forecast(Maximum Utility Rule) • The relevant market consists of products P1, P2, . . . , PN. Some of theses may be existing products and, others concepts being evaluated. • Each consumer will prefer to buy the product with the highest utility among those available. Then forecasted market share for products Pi is given by: KConsumers who prefer i MS (Pi) = å –––––––––––––––– K=1K where K is the number of consumers who participated in the study.
Other Choice Rules Share of utility rule: Under this choice rule, the consumer selects each product with a probability that is proportional to the utility of that compared to the total utility derived from all the products in the choice set. Logit choice rule: This is similar to the share of utility rule, except that it gives larger weights to more preferred alternatives and smaller weights to less preferred alternatives. Alpha rule: Modified version of share of utility rule. Before applying the share of utility, the utility functions are modified by an “alpha” factor so that the computed market shares of existing products are as close as possible to their actual market shares.
Example Market Share Computation (Frozen Pizza Example) • Market consists of three products and three consumers Product (P1) (P2) (P3) Aloha Meat-lover’s Veggie Special Treat Delite Crust Pan Thick Thin Topping Pineapple Pepperoni Veggie Type of cheese Mozzarella Mixed cheese Romano Amt. of cheese 4 oz. 6 oz. 2 oz. Price $8.99 $9.99 $7.99
Example Market Share Computation (Frozen Pizza Example) Consumers’ Part-Worths C1 C2 C3 Pan 0 10 26 Thin 9 37 0 Thick 11 0 10 Pineapple 17 3 0 Veggie 6 0 14 Sausage 13 3 7 Pepperoni 0 0 19 Romano 52 0 21 Mixed cheese 13 9 0 Mozzarella 0 3 14 2 oz 0 0 0 4 oz. 8 39 16 6 oz. 10 21 12 $9.99 0 0 0 $8.99 10 4 18 $7.99 10 12 16
Example Market Share Computation (Frozen Pizza Example) Computed Utility for Products Customer P1 P2 P3 C1 35 34 77 C2 59 30 49 C3 74 41 51 • Infrequently purchased products:Consumers only buy the brand with the highest utility. Then, the market share for Product 1 is 66.6% and Product 3 is 33.4%. • Frequently purchased products (Share of utility rule) Assume each consumer buys the same amount. Then Market share of P1 = (0.24 +0.43+0.45)/3 = 37.3% Market share of P2 = (0.23+0.22+0.25)/3 = 23.3% Market share of P3 = (0.53+0.35+0.30)/3 = 39.4%
Share of Utility Rule • Describe competitive set • Assign individual weights if any • Compute market share åwi pij i mj = –––––––––– ååwi pij j i mj: market share of product j wi: weights assigned to individual i
How to Use in Design/Tradeoff Evaluation • Example: Italian vs Thai = 20 – 16 = 4 util units $10 vs $15 = 22 – 14 = 8 util units • So “Thai”is worth $2.50 more than “Italian” for this customer: ÞCan use to obtain value to customer of service (non-price) attributes.
Another Example of Conjoint AnalysisAir Pollution Control Systems • Dürr Environmental is developing a new air pollution control system (thermal oxidizer) to compete against existing offerings from Waste Watch, Thermatrix, and Advanced Air. • Key offering attributes: • Thermal efficiency • Delivery time • List price • Delivery terms • Q: What to offer? • Who will buy/who to target? • Where will share come from?
An Example Conjoint Study:Air Pollution Control Equipment Attributes • Performance specs (4 options) • Delivery time (4 options) • Price (4 options) • Delivery_terms (4 options) Efficiency Delivery timeList Price Exceed by 9% 6 months $600k Exceed by 5% 9 months $700k Meets target 12 months $800k Short by 5% 15 months $900k Delivery terms Installed, 2-year guarantee Installed, 1-year guarantee Installed, service contract FOB seller, service contract A total of 256 (4x4x4x4) different offerings can be designed from these options!
Customer’s Utility Sunoco Mattel ICI Base 0 0 0 Meets target 5 10 10 Exceed 5% 35 0 40 Exceed 9% 40 0 50 12 months 20 5 3 9 months 30 20 8 6 months 40 10 10 $800k 5 20 2 $700K 8 35 5 $600K 10 50 10 Inst_ser 6 5 10 Inst_1Yr 8 10 20 Inst_2Yr 10 20 30 Market Share Computation:(Air Pollution Control Equipment)
Market consists of three products and three customers Market Share Computation (Air Pollution Control Equipment) Product Waste watch Thermatrix Advanced Air Performance specs Exceed 5% Exceed 20% Meet Specs Delivery time 9 months 9 months 6 months List Price $800k $900k $700k Delivery terms FOB_ser Inst_1Yr Inst_ser
Market Share Computation:(Air Pollution Control Equipment) Computed Utility for Products Waste Watch Thermatrix Advanced Air Sunoco 70 78 61 Mattel 40 30 75 ICI 50 7840 • Maximum Utility Rule: If we assume customers will only buy the product with the highest utility, the market share for Thermatrix is 2/3 and 1/3 for Wahlco. • Share of preference rule: If we assume that each customer will buy each product in proportion to its utility relative to the other products, then market shares for the three products are: Waste Watch: 30.3% Thermatrix: 34.8 Advanced Air: 34.9
Identifying Segments Based onConjoint Part Worths (Airpol.pwr) Analyze Airpol.pwr file in Cluster Analysis to obtain the above results.
Members in Each Segment Segment 1. Companies in this Segment include • Cummins Engineering, Illinois Tools, Mattel, Neste-Resin, Ralston Purina, New World Technologies, Baltimore Gas, Applied Coatings, Pharmasyn, and Thermal Electric. • These are smaller companies that operate in industries without major pollution problems. They want an equipment that meets EPA efficiency target, medium delivery times, have high price sensitivity, and require installation and warranty.
Members in Each Segment Segment 2. Companies in this Segment include • ICI, Mobil, Maytag, Texaco, Union Carbide, Dow Chemicals, Boise Cascade, and 3M. • These are large chemical and paper companies that have pollution issues to deal with. They want an equipment that Exceeds EPA efficiency target, have long delivery times (perhaps for installation in new factories that they build), have moderate price sensitivity, and do not require installation help or warranty (FOB).
Members in Each Segment Segment 3. Companies in this Segment include • Deere, Intel, Air Products, Sunoco, HP, Conagra, Kimberly-Clark, Hershey, and Westinghouse Electric. • These are large companies that seem to operate in industries with less severe pollution problems. They want an equipment that Exceeds EPA efficiency target, prefer quick/medium delivery, have low price sensitivity, and moderately prefer installation and warranty.
Other Aspects to Consider • Incorporate revenue potential of a product • Market share Incremental margin over base product • Design optimal product by segment • Segment 1 (Value segment): A product that meets EPA target, with delivery of 6 months, priced at 600K, and with installation and 2-year warranty has the potential to get 42% share of the market and good revenue potential against the three existing competitors. • Segment 3 (Premium segment): A product that exceeds EPA target by 5%, with delivery of 9 months, priced at 700K, and with installation and 2-year warranty has the potential to get 31% share and high revenue potential.
Situations Where Conjoint Analysis Might Be Valuable • The new concept involves important tradeoffs affecting design, production, marketing, or other operational variables. • Product/service is realistically decomposable into a set of basic attributes. • Product/service choice tends to be high involvement. • Factorial combinations of basic attribute levels are believable. • Desirable new-product alternatives can be synthesized from basic alternatives. • Product/service alternatives can be realistically described, either verbally or pictorially. (Otherwise, actual product formulations should be considered).
Some Commercial Applications of Conjoint Analysis Consumer Industrial/BusinessNon-Durables Goods Other Products 1. Bar soaps 1. Copying machines 1. Automotive styling 2. Hair shampoos 2. Printing equipment 2. Automobile tires 3. Carpet cleaners 3. Fax machines 3. Car batteries 4. Synthetic-fiber garments 4. Data transmission 4. Ethical drugs 5. Gasoline pricing 5. Lap top computer 5. Employee benefit 6. Pantyhose 6. Job offers to MBA’s package Financial Services Transportation Other Services 1. Branch bank services 1. Air Canada 1. Car rental agencies 2. Auto insurance policies 2. IATA 2. Telephone service pricing 3. Health insurance policies 3. American Airlines 3. Hotels 4. Credit card features 4. Canadian National Railway 4. Medical laboratories 5. Consumer discount card 5. Amtrak 5. Employment agencies
Methods for ForecastingNew Product Sales Early stages of development Chain ratio method Judgmental methods Scenario Analysis Diffusion modeling Later stages of development Pre-test market methods Test-market methods
The Bass Diffusion Model Model designed to answer the question: When will customers adopt a new product or technology?
Assumptions of theBasic Bass Model • Diffusion process is binary (consumer either adopts, or waits to adopt) • Constant maximum potential number of buyers (N) • Eventually, all N will buy the product • No repeat purchase, or replacement purchase • The impact of the word-of-mouth is independent of adoption time • Innovation is considered independent of substitutes • The marketing strategies supporting the innovation are not explicitly included
Adoption Probability over Time (a) 1.0 Cumulative Probability of Adoption up to Time t F(t) Introduction of product Time (t) (b) f(t) = d(F(t))dt Density Function: Likelihood of Adoption at Time t Time (t)