Download
1 / 30
300 likes | 327 Vues
Explore the molecular interpretation of bulk properties in gases, liquids, and solids. Learn about intermolecular forces creating structure, compressibility, thermal expansion, fluidity, rigidity, diffusion, surface tension, and various intermolecular forces like ion-ion, dipole-dipole, ion-dipole, charge-induced dipole, and more. Discover the potential energies between ions, dipoles, and Van der Waals interactions through diagrams and explanations.

E N D
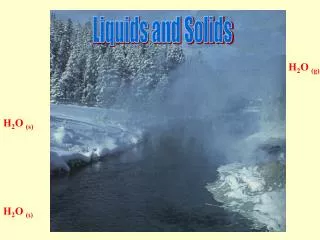
SOLIDS, LIQUIDS, AND PHASE TRANSITIONS 10 CHAPTER 10.1 Bulk Properties of Gases, Liquids, and Solids: Molecular Interpretation 10.2 Intermolecular Forces: Origins in MolecularStructure 10.3 Intermolecular Forces in Liquids 10.4 Phase Equilibrium 10.5 Phase Transitions 10.6 Phase Diagrams General Chemistry I
443 I2(s) I2(g) I2(s)
444 10.1 BULK PROPERTIES OF GASES, LIQUIDS, AND SOLIDS: MOLECULAR INTERPRETATION • Molar Volume Solids, liquids: 10–100 cm3 /mol, 3–5 Å between molecules (cf. bond lengths; 0.5–2.5 Å) Gases: ~24000 cm3 /mol, ~30Å between molecules Fig. 10.1 Intermolecular forces create structure in liquids and solids. (a) Solid (b) Liquid (c) Gas
445 • Compressibility • Isothermal compressibility, ~ Fractional volume decrease against the pressure increase Solids, liquids: nearly incompressible, (nearly) in contact, strong intermolecular forces Gases: highly compressible, space between molecules • Thermal Expansion • Thermal Expansion Coefficient, ~ Fractional volume increase against the temperature increase
446 • Ideal gas At 0oC, → 0.366% volume increase
447 • Fluidity and Rigidity - Fluidity of gases and liquids vs. rigidity of solids - shear viscosity: the resistance of a material to macroscopic flow most liquids 16 orders of magnitude smaller than those of solids • Diffusion - Molecules of one type migrate into regions initially occupied only by the other type. - diffusion constant: measuring the rate of diffusive mixing - In liquids, quickly changing the neighbors and finding new interactions due to low shear viscosity In solids, a durable arrangement of neighbors
448 Fig. 10.2 Computer simulated picture of the motion of atoms in a tiny melting crystal, the atoms at the center(in the solid) move erratically about particular sites. The atoms at the surface (in the liquid) move much greater distances.
448 ◈ Surface tension, → Resistance of the surface of a liquid to an increase in its area (unit: N·m–1 or J·m–2) → Surface tension is the net inward pull on surface molecules. → Liquids with strong intermolecular interaction have high surface tension.
448 Fig. 10.3 (a) Spherical shape of a water droplet after it hits the surface of a pool and bounced up. (b) A water drop and a mercury drop at the dropper tip. The mercury drop is a perfect sphere whereas the water drop sags slightly due to difference in the surface tension.
449 10.2 INTERMOLECULAR FORCES: ORIGINS IN MOLECULAR STRUCTURE • Ion-Ion Forces • Strong, long-range, not directional Coulombic potential • Dipole-Dipole Forces • Depends on orientations of two dipolar molecules. • Potential energy between two dipoles • ~ shorter range than Coulomb potential
450 • Weaker than thermal energy: • ~ Can not hold a rigid molecular assembly • Strong enough to influence b.p., m.p., and molecular orientations Fig 10.5 The dipole-dipole forces between two HCl molecules depend on their orientations.
450 • Ion-Dipole Forces • Potential energy between ion and dipole • Dissolution of salts in water (polar solvent) Fig 10.6 Na+ and Cl ions are surrounded by water dipoles. Orientation of water molecules are reversed.
451 • Charge-Induced Dipole Forces • Potential energy between ion and induced dipole • Weak and short range • Electrical polarizability • ~ Relative tendency of a charge distribution to be distorted • from itsnormal shape by an external electric field • ~ Measure by the magnitude of the induced dipole moment Fig. 10.7 Distortion of electron distribution of Ar as an ion is approached.
452 • Induced Dipole-Induced Dipole Forces • Potential energy between two induced dipoles • Weak (~1 kJ/mol) and short range, • Attraction between Ar atoms: London dispersion force • Fluctuation of electron distribution in one molecule • temporary dipole • Second temporary dipole in the other ··· Fig. 10.8 A fluctuation of the electron distribution on one atom induces a corresponding temporary dipole moment on a neighboring atom.
453 Potential Energies between ions, ions and dipoles, stationary dipoles, and rotating dipoles. * Van der Waals interactions ◈ ATTRACTIVEINTERACTIONS: A SUMMARY ▶ Ion – Ion (Coulomb): ▶ Ion – Dipole: ▶ Dipole – Dipole: ▷Rotating polar gas molecules*: ▶ Dipole – Induced dipole*: ▶ London (dispersion)*: (Induced dipole – Induced dipole)
454 Potential energy v. separation diagrams Ar + Ar : dispersion only HCl + HCl : dipole-dipole anddispersion Cl + Cl : covalent interaction K+ + Cl- : ion-ion interaction
455 • Shape of Molecules and Electrostatic Forces • Electrostatic potential energy map • ~ Shows the shape and size of the molecule, the sign and • magnitude of the electrostatic potential at the “surface” of • the molecule. Fig. 10.10 Electrostatic potential Fig. 10.11 Electrostatic potential energy map of acetone. energy map of acetaldehyde. → The dipole moment and charge separation are shown in both figures.
455 10.3 INTERMOLECULAR FORCES IN LIQUIDS • Hydrogen bonding (….) H bonded to O, N, F (electronegative, lone-pair) interacts with a lone electron pair of another nearby O, N, or F linear but asymmetric Strong electrostatic interaction; stronger than most intermolecular interactions E.g. H2O, HF, NH3 175 pm 101 pm Fig. 10.13 A single hydrogen bond between water molecules forms a dimer and the electrostatic potential energy map for H2O.
456 General increase In Tb is caused by increase in London forces with increase in molar mass Fig. 10.12 The boiling points of hydrides of some main group elements and the noble gases.
458 The structure of ice
458 • Special Properties of Water Maximum density at 3.98°C, high Tb , high heat capacity Density of ice is lower than that of water! Ice remains at the surface. Warmer water under the ice.
459 10.4 PHASE EQUILIBRIUM • Phase~ a sample of matter uniform throughout in both • chemical and physical states • Phase Equilibrium • dynamic process; no net flow of matter between phases • rate of evaporation = rate of condensation • independent of the direction (with enough material) Fig. 10.16 Approach to equilibrium in evaporation and condensation.
460 Fig. 10.17 Vapor pressure vs. temperature. The temperature at which the vapor pressure becomes 1 atm defines the normal boiling point of liquid and the normal sublimation point of a solid. Pvapor(water) = 0.03126 atm (at 25°C) = 1 atm (at 100oC) ← normal boiling point Pvapor(CO2) = 1 atm (at –78.5oC) ← normal sublimation point
460 10.5 PHASE TRANSITIONS ~ Transformation of a thermodynamic system from one phase or state of matter to another • P = 4.52 atm • V = 5.50 L (Ideal gas: PV = nRT) • = 4.74 L (van der Waals Eq.) • P > 4.52 atm • liquefying (l), freezing (s) • Liquefying: • intermolecular attractions • > kinetic energy (3/2 RT) Condensation or liquefaction Solidification or freezing Fig. 10.18 Compression of 1 mol SO2 at 30 oC.
461 • Phase transitions between three states • Gas Liquid Boiling point (b.p.), Tb • Liquid Solid Melting (m.p.)/Freezing (f.p.) point, Tf • Gas Solid Sublimation point, Ts • Superheating • ~ Raising the temperature of a liquid • above its b.p. without it becoming a gas • Supercooling (undercooling) • ~ Lowering the temperature of a liquid or • a gas below its f.p. without it becoming • a solid Fig. 10.19 Six phase transitions.
463 10.6 PHASE DIAGRAMS • Phase Diagram • A plot of P vs. T showing the stable state of a substance • phase boundaries, triple point, and critical point • Triple point • Three phases coexist in equilibrium • T = 0.01oC, P = 0.006 atm for water • Critical point • Terminal point of liquid-gas boundary • Supercritical fluid ~ no phase boundary (no meniscus) • ~ critical opalescence • Tc = 374.2 oC, Pc = 218 atm for water
463 • Critical point • Tc = 374.2oC • Pc = 218 atm • Triple point • Tt = 0.01oC • Pt = 0.006 atm Fig. 10.21 Phase diagram for water.
464 Fig. 10.23 Phase diagrams of Ar, CO2, and water.
10 Problem Sets For Chapter 10, 8, 16, 22, 26, 32, 36, 42, 50, 56, 62