Download
1 / 29
290 likes | 306 Vues
This talk discusses the measurement and analysis of the underlying event in high-energy particle collisions at the CDF and LHC experiments, comparing the properties of the leading jet and Z-boson event topologies. It covers the different regions of the event space, observables, and QCD Monte-Carlo models used to describe the underlying event. The results and extrapolation to the LHC are also presented.

E N D
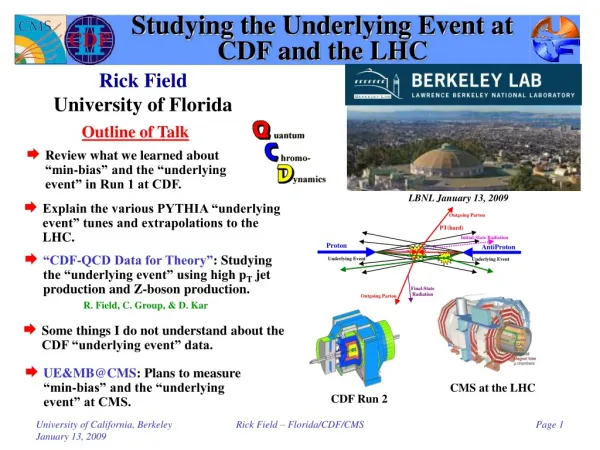
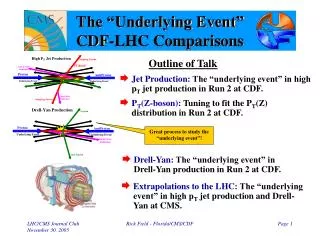
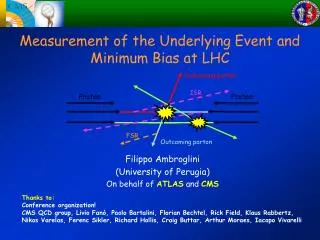
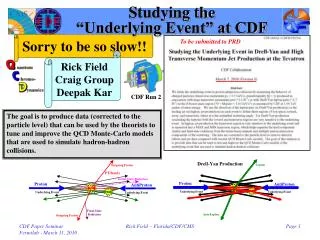
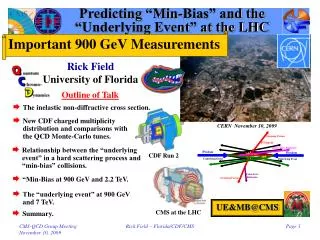
Studying the Underlying Event at CDF and the LHC “Leading Jet” vs Z-Boson Perugia, Italy October 27. 2008 Rick Field Craig Group Deepak Kar Rick Field University of Florida Outline of Talk • The “Towards”, “Away”, and “Transverse” regions of h-f space. • Four Jet Topologies plus Drell-Yan. • The “transMAX” and “transMIN” regions. • The observables: First look at average quantities. Then do distributions. • Look at <pT> versus Nchg in “min-bias” and Drell-Yan. • Show some extrapolations of Drell-Yan to the LHC. CDF Run 2 CMS at the LHC Rick Field – Florida/CDF/CMS
UE&MB@CMS Initial Group Members Rick Field (Florida) Darin Acosta (Florida) Paolo Bartalini (Florida) Albert De Roeck (CERN) Livio Fano' (INFN/Perugia at CERN) Filippo Ambroglini (INFN/Perugia at CERN) Khristian Kotov (UF Student, Acosta) See the talks by Filippo Ambroglini and Florian Bechtel tomorrow morning! PTDR Volume 2 Section 3.3.2 • Measure Min-Bias and the “Underlying Event” at CMS • The plan involves two phases. • Phase 1 would be to measure min-bias and the “underlying event” as soon as possible (when the luminosity is low), perhaps during commissioning. We would then tune the QCD Monte-Carlo models for all the other CMS analyses. Phase 1 would be a service to the rest of the collaboration. As the measurements become more reliable we would re-tune the QCD Monte-Carlo models if necessary and begin Phase 2. • Phase 2 is “physics” and would include comparing the min-bias and “underlying event” measurements at the LHC with the measurements we have done (and are doing now) at CDF and then writing a physics publication. Perugia, Italy, March 2006 UE&MB@CMS Florida-Perugia-CERN University of Perugia Rick Field – Florida/CDF/CMS
“Hard Scattering” Component QCD Monte-Carlo Models:High Transverse Momentum Jets • Start with the perturbative 2-to-2 (or sometimes 2-to-3) parton-parton scattering and add initial and final-state gluon radiation (in the leading log approximation or modified leading log approximation). “Underlying Event” • The “underlying event” consists of the “beam-beam remnants” and from particles arising from soft or semi-soft multiple parton interactions (MPI). The “underlying event” is an unavoidable background to most collider observables and having good understand of it leads to more precise collider measurements! • Of course the outgoing colored partons fragment into hadron “jet” and inevitably “underlying event” observables receive contributions from initial and final-state radiation. Rick Field – Florida/CDF/CMS
“Hard Scattering” Component QCD Monte-Carlo Models:Lepton-Pair Production • Start with the perturbative Drell-Yan muon pair production and add initial-state gluon radiation (in the leading log approximation or modified leading log approximation). “Underlying Event” • The “underlying event” consists of the “beam-beam remnants” and from particles arising from soft or semi-soft multiple parton interactions (MPI). • Of course the outgoing colored partons fragment into hadron “jet” and inevitably “underlying event” observables receive contributions from initial-state radiation. Rick Field – Florida/CDF/CMS
“Towards”, “Away”, “Transverse” Look at the charged particle density, the charged PTsum density and the ETsum density in all 3 regions! • Look at correlations in the azimuthal angle Df relative to the leading charged particle jet (|h| < 1) or the leading calorimeter jet (|h| < 2). • Define |Df| < 60o as “Toward”, 60o < |Df| < 120o as “Transverse ”, and |Df| > 120o as “Away”. Each of the three regions have area DhDf = 2×120o = 4p/3. Df Correlations relative to the leading jet Charged particles pT > 0.5 GeV/c |h| < 1 Calorimeter towers ET > 0.1 GeV |h| < 1 “Transverse” region is very sensitive to the “underlying event”! Z-Boson Direction Rick Field – Florida/CDF/CMS
Event Topologies • “Leading Jet” events correspond to the leading calorimeter jet (MidPoint R = 0.7) in the region |h| < 2 with no other conditions. “Leading Jet” subset • “Inclusive 2-Jet Back-to-Back” events are selected to have at least two jets with Jet#1 and Jet#2 nearly “back-to-back” (Df12 > 150o) with almost equal transverse energies (PT(jet#2)/PT(jet#1) > 0.8) with no other conditions . “Inc2J Back-to-Back” subset “Exc2J Back-to-Back” • “Exclusive 2-Jet Back-to-Back” events are selected to have at least two jets with Jet#1 and Jet#2 nearly “back-to-back” (Df12 > 150o) with almost equal transverse energies (PT(jet#2)/PT(jet#1) > 0.8) and PT(jet#3) < 15 GeV/c. “Charged Jet” • “Leading ChgJet” events correspond to the leading charged particle jet (R = 0.7) in the region |h| < 1 with no other conditions. • “Z-Boson” events are Drell-Yan events with 70 < M(lepton-pair) < 110 GeV with no other conditions. Z-Boson Rick Field – Florida/CDF/CMS
“transMAX” & “transMIN” • Define the MAX and MIN “transverse” regions (“transMAX” and “transMIN”) on an event-by-event basis with MAX (MIN) having the largest (smallest) density. Each of the two “transverse” regions have an area in h-f space of 4p/6. “transMIN” very sensitive to the “beam-beam remnants”! Z-Boson Direction Area = 4p/6 • The “transMIN” region is very sensitive to the “beam-beam remnant” and the soft multiple parton interaction components of the “underlying event”. • The difference, “transDIF” (“transMAX” minus “transMIN”), is very sensitive to the “hard scattering” component of the “underlying event” (i.e. hard initial and final-state radiation). • The overall “transverse” density is the average of the “transMAX” and “transMIN” densities. Rick Field – Florida/CDF/CMS
Observables at theParticle and Detector Level “Leading Jet” “Back-to-Back” Rick Field – Florida/CDF/CMS
CDF Run 1 PT(Z) Tune used by the CDF-EWK group! PYTHIA 6.2 CTEQ5L • Shows the Run 1 Z-boson pT distribution (<pT(Z)> ≈ 11.5 GeV/c) compared with PYTHIA Tune A (<pT(Z)> = 9.7 GeV/c), and PYTHIA Tune AW (<pT(Z)> = 11.7 GeV/c). UE Parameters ISR Parameters Effective Q cut-off, below which space-like showers are not evolved. Intrensic KT The Q2 = kT2 in as for space-like showers is scaled by PARP(64)! Rick Field – Florida/CDF/CMS
Df Jet#1-Jet#2 Jet#1-Jet#2 Df Distribution Jet-Jet Correlations (DØ) • MidPoint Cone Algorithm (R = 0.7, fmerge = 0.5) • L= 150 pb-1 (Phys. Rev. Lett. 94 221801 (2005)) • Data/NLO agreement good. Data/HERWIG agreement good. • Data/PYTHIA agreement good provided PARP(67) = 1.0→4.0 (i.e. like Tune A, best fit 2.5). Rick Field – Florida/CDF/CMS
CDF Run 1 PT(Z) PYTHIA 6.2 CTEQ5L • Shows the Run 1 Z-boson pT distribution (<pT(Z)> ≈ 11.5 GeV/c) compared with PYTHIA Tune DW, and HERWIG. UE Parameters ISR Parameters Tune DW uses D0’s perfered value of PARP(67)! Intrensic KT Tune DW has a lower value of PARP(67) and slightly more MPI! Rick Field – Florida/CDF/CMS
PYTHIA 6.2 Tunes All use LO as with L = 192 MeV! UE Parameters Uses CTEQ6L Tune A energy dependence! ISR Parameter Intrinsic KT Rick Field – Florida/CDF/CMS
PYTHIA 6.2 Tunes These are “old” PYTHIA 6.2 tunes! See the talks by Arthur Moraes and Hendrik Hoeth for “new” tunes! All use LO as with L = 192 MeV! UE Parameters ATLAS energy dependence! ISR Parameter Intrinsic KT Rick Field – Florida/CDF/CMS
JIMMY at CDF JIMMY was tuned to fit the energy density in the “transverse” region for “leading jet” events! JIMMY Runs with HERWIG and adds multiple parton interactions! PT(JIM)= 2.5 GeV/c. The Drell-Yan JIMMY Tune PTJIM = 3.6 GeV/c, JMRAD(73) = 1.8 JMRAD(91) = 1.8 The Energy in the “Underlying Event” in High PT Jet Production JIMMY: MPI J. M. Butterworth J. R. Forshaw M. H. Seymour PT(JIM)= 3.25 GeV/c. “Transverse” <Densities> vs PT(jet#1) Rick Field – Florida/CDF/CMS
Charged Particle Density HERWIG + JIMMY Tune (PTJIM = 3.6) • Data at 1.96 TeV on the density of charged particles, dN/dhdf, with pT > 0.5 GeV/c and |h| < 1 for “Z-Boson” and “Leading Jet” events as a function of the leading jet pT or PT(Z) for the “toward”, “away”, and “transverse” regions. The data are corrected to the particle level (with errors that include both the statistical error and the systematic uncertainty) and are compared with PYTHIA Tune AW and Tune A, respectively, at the particle level (i.e. generator level). Rick Field – Florida/CDF/CMS
Charged PTsum Density • Data at 1.96 TeV on the charged scalar PTsum density, dPT/dhdf, with pT > 0.5 GeV/c and |h| < 1 for “Z-Boson” and “Leading Jet” events as a function of the leading jet pT or PT(Z) for the “toward”, “away”, and “transverse” regions. The data are corrected to the particle level (with errors that include both the statistical error and the systematic uncertainty) and are compared with PYTHIA Tune AW and Tune A, respectively, at the particle level (i.e. generator level). Rick Field – Florida/CDF/CMS
The “TransMAX/MIN” Regions • Data at 1.96 TeV on the charged particle density, dN/dhdf, with pT > 0.5 GeV/c and |h| < 1 for “Z-Boson” and “Leading Jet” events as a function of PT(Z) or the leading jet pT for the “transMAX”, and “transMIN” regions. The data are corrected to the particle level (with errors that include both the statistical error and the systematic uncertainty) and are compared with PYTHIA Tune AW and Tune A, respectively, at the particle level (i.e. generator level). • Data at 1.96 TeV on the density of charged particles, dN/dhdf, with pT > 0.5 GeV/c and |h| < 1 for “leading jet” events as a function of the leading jet pT and for Z-Boson events as a function of PT(Z) for “TransDIF” =“transMAX” minus “transMIN” regions. The data are corrected to the particle level (with errors that include both the statistical error and the systematic uncertainty) and are compared with PYTHIA Tune A and HERWIG (without MPI) at the particle level (i.e. generator level). Rick Field – Florida/CDF/CMS
The “TransMAX/MIN” Regions • Data at 1.96 TeV on the charged scalar PTsum density, dPT/dhdf, with pT > 0.5 GeV/c and |h| < 1 for “Z-Boson” and “Leading Jet” events as a function of PT(Z) or the leading jet pT for the “transMAX”, and “transMIN” regions. The data are corrected to the particle level (with errors that include both the statistical error and the systematic uncertainty) and are compared with PYTHIA Tune AW and Tune A, respectively, at the particle level (i.e. generator level). • Data at 1.96 TeV on the charged scalar PTsum density, dPT/dhdf, with pT > 0.5 GeV/c and |h| < 1 for “leading jet” events as a function of the leading jet pT and for Z-Boson events as a function of PT(Z) for “TransDIF” =“transMAX” minus “transMIN” regions. The data are corrected to the particle level (with errors that include both the statistical error and the systematic uncertainty) and are compared with PYTHIA Tune A and HERWIG (without MPI) at the particle level (i.e. generator level). Rick Field – Florida/CDF/CMS
Charged Particle <pT> • Data at 1.96 TeV on the charged particle average pT, with pT > 0.5 GeV/c and |h| < 1 for the “toward” region for “Z-Boson” and the “transverse” region for “Leading Jet” events as a function of the leading jet pT or PT(Z). The data are corrected to the particle level (with errors that include both the statistical error and the systematic uncertainty) and are compared with PYTHIA Tune AW and Tune A, respectively, at the particle level (i.e. generator level). The Z-Boson data are also compared with PYTHIA Tune DW, the ATLAS tune, and HERWIG (without MPI) Rick Field – Florida/CDF/CMS
Z-Boson: “Towards”, Transverse”, & “TransMIN” Charge Density • Data at 1.96 TeV on the density of charged particles, dN/dhdf, with pT > 0.5 GeV/c and |h| < 1 for “Z-Boson” events as a function of PT(Z) for the “toward” and “transverse” regions. The data are corrected to the particle level (with errors that include both the statistical error and the systematic uncertainty) and are compared with PYTHIA Tune AW and HERWIG (without MPI) at the particle level (i.e. generator level). Rick Field – Florida/CDF/CMS
Z-Boson: “Towards”, Transverse”, & “TransMIN” Charge Density • Data at 1.96 TeV on the charged scalar PTsum density, dPT/dhdf, with pT > 0.5 GeV/c and |h| < 1 for “Z-Boson” events as a function of PT(Z) for the “toward” and “transverse” regions. The data are corrected to the particle level (with errors that include both the statistical error and the systematic uncertainty) and are compared with PYTHIA Tune AW and HERWIG (without MPI) at the particle level (i.e. generator level). Rick Field – Florida/CDF/CMS
DWT Z-Boson: “Towards” Region • Data at 1.96 TeV on the density of charged particles, dN/dhdf, with pT > 0.5 GeV/c and |h| < 1 for “Z-Boson” events as a function of PT(Z) for the “toward” region. The data are corrected to the particle level (with errors that include both the statistical error and the systematic uncertainty) and are compared with PYTHIA Tune AW and HERWIG (without MPI) at the particle level (i.e. generator level). HW without MPI Rick Field – Florida/CDF/CMS
DWT Z-Boson: “Towards” Region • Data at 1.96 TeV on the average pT of charged particles with pT > 0.5 GeV/c and |h| < 1 for “Z-Boson” events as a function of PT(Z) for the “toward” region. The data are corrected to the particle level (with errors that include both the statistical error and the systematic uncertainty) and are compared with PYTHIA Tune AW and HERWIG (without MPI) at the particle level (i.e. generator level). HW (without MPI) almost no change! Rick Field – Florida/CDF/CMS
Charged <PT> versus Nchg See the talk by Peter Skands on Thursday morning! • Shows the average transverse momentum of charged particles (|h|<1, pT>0.5 GeV) versus the number of charged particles, Nchg, at the detector level for the CDF Run 2 Min-Bias events. The charged <PT> rises with Nchg! Rick Field – Florida/CDF/CMS
Min-Bias Correlations New See the talk by Niccolo Moggi this afternoon! • Data at 1.96 TeV on the average pT of charged particles versus the number of charged particles (pT > 0.4 GeV/c, |h| < 1) for “min-bias” collisions at CDF Run 2. The data are corrected to the particle level and are compared with PYTHIA Tune A at the particle level (i.e. generator level). Rick Field – Florida/CDF/CMS
Average PT versus Nchg New • Data at 1.96 TeV on the average pT of charged particles versus the number of charged particles (pT > 0.4 GeV/c, |h| < 1) for “min-bias” collisions at CDF Run 2. The data are corrected to the particle leveland are compared with PYTHIA Tune A, Tune DW, and the ATLAS tune at the particle level (i.e. generator level). • Particle level predictions for the average pT of charged particles versus the number of charged particles (pT > 0.5 GeV/c, |h| < 1, excluding the lepton-pair) for for Drell-Yan production (70 < M(pair) < 110 GeV) at CDF Run 2. Rick Field – Florida/CDF/CMS
Average PT(Z) versus Nchg New No MPI! • Predictions for the average PT(Z-Boson) versus the number of charged particles (pT > 0.5 GeV/c, |h| < 1, excluding the lepton-pair) for for Drell-Yan production (70 < M(pair) < 110 GeV) at CDF Run 2. • Data on the average pT of charged particles versus the number of charged particles (pT > 0.5 GeV/c, |h| < 1, excluding the lepton-pair) for for Drell-Yan production (70 < M(pair) < 110 GeV) at CDF Run 2. The data are corrected to the particle level and are compared with various Monte-Carlo tunes at the particle level (i.e. generator level). Rick Field – Florida/CDF/CMS
Average PT versus Nchg New PT(Z) < 10 GeV/c No MPI! Remarkably similar behavior! Perhaps indicating that MPI playing an important role in both processes. • Predictions for the average pT of charged particles versus the number of charged particles (pT > 0.5 GeV/c, |h| < 1, excluding the lepton-pair) for for Drell-Yan production (70 < M(pair) < 110 GeV, PT(pair) < 10 GeV/c) at CDF Run 2. • Data the average pT of charged particles versus the number of charged particles (pT > 0.5 GeV/c, |h| < 1, excluding the lepton-pair) for for Drell-Yan production (70 < M(pair) < 110 GeV, PT(pair) < 10 GeV/c) at CDF Run 2. The data are corrected to the particle level and are compared with various Monte-Carlo tunes at the particle level (i.e. generator level). Rick Field – Florida/CDF/CMS
Summary • It is important to produce a lot of plots (corrected to the particle level) so that the theorists can tune and improve the QCD Monte-Carlo models. If they improve the “transverse” region they might miss-up the “toward” region etc.. We need to show the whole story! • We are making good progress in understanding and modeling the “underlying event” in jet production and in Drell-Yan. Tune A and Tune AW describe the data very well, although not perfect. However, we do not yet have a perfect fit to all the features of the CDF “underlying event” data! CDF Run 2 publication. Should be out by the end of the year! • Looking at <pT> versus Nchg in Drell-Yan with 70 < Mpair) < 110 GeV and PT(pair) < 5 GeV is a good way to look at MPI and the color connections. The data show the correlations expected from MPI! • There are over 128 plots to get “blessed” and then to published. So far we have only looked at average quantities. We plan to also produce distributions and flow plots. CDF-QCD Data for Theory • I plan to construct a “CDF-QCD Data for Theory” WEBsite with the “blessed” plots together with tables of the data points and errors so that people can have access to the results . Rick Field – Florida/CDF/CMS