
Uploaded by
juana
1 SLIDES
114 VUES
10LIKES
Identifying QTLs and Marker Density Impact on Power and FDR in QTL Analysis
DESCRIPTION
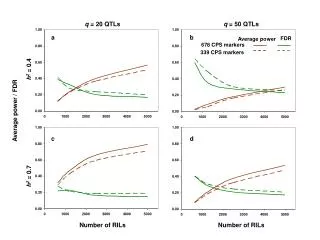
Explore the impact of QTLs, marker density, and heritability on statistical power, FDR, and marker effects in QTL analysis. Investigate the effect of varying marker densities on the average power and FDR.
Download
1 / 1
Télécharger la présentation 
Identifying QTLs and Marker Density Impact on Power and FDR in QTL Analysis
An Image/Link below is provided (as is) to download presentation
Download Policy: Content on the Website is provided to you AS IS for your information and personal use and may not be sold / licensed / shared on other websites without getting consent from its author.
Content is provided to you AS IS for your information and personal use only.
Download presentation by click this link.
While downloading, if for some reason you are not able to download a presentation, the publisher may have deleted the file from their server.
During download, if you can't get a presentation, the file might be deleted by the publisher.
E N D
Presentation Transcript
q = 20 QTLs q = 50 QTLs a b FDR Average power h2 = 0.4 678 CPS markers 339 CPS markers Average power / FDR c d h2 = 0.7 Number of RILs Number of RILs
More Related