Download
1 / 25
250 likes | 268 Vues
Explore the process and benefits of internal curing using microtomography to observe water distribution in concrete. Learn about the importance of mixture proportions and blended cements for effective curing.

E N D
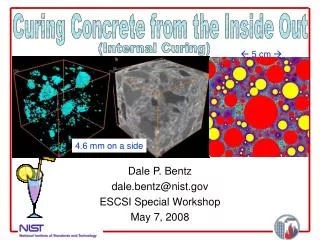
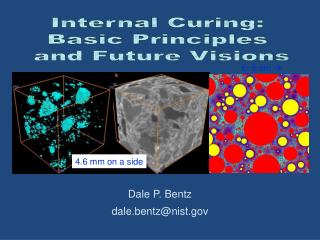
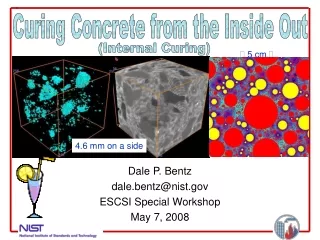
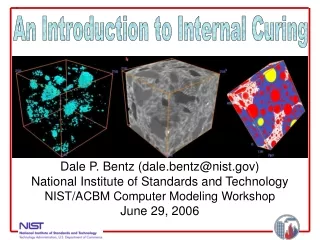
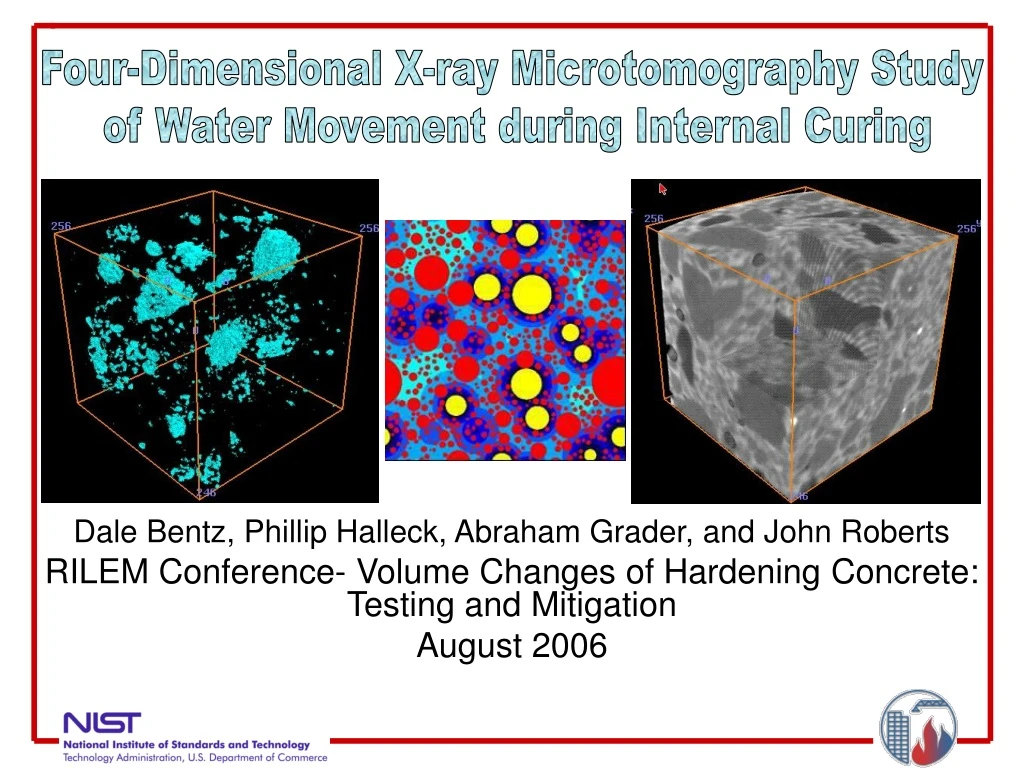
Four-Dimensional X-ray Microtomography Study of Water Movement during Internal Curing Dale Bentz, Phillip Halleck, Abraham Grader, and John Roberts RILEM Conference- Volume Changes of Hardening Concrete: Testing and Mitigation August 2006
Outline • Need for internal curing • Blended cements • “Undercuring” with internal curing • Microtomography observations of water movement during internal curing • Quantitative analysis of 3-D images • Mixture proportioning for internal curing
What is internal curing (IC)? Answer: As being considered by ACI-308, “internal curing refers to the process by which the hydration of cement occurs because of the availability of additional internal water that is not part of the mixing water.” For many years, we have been curing concrete from the outside in, internal curing is for curing from the inside out. Internal water is generally supplied via internal reservoirs, such as saturated lightweight fine aggregates, superabsorbent polymers, or saturated wood fibers.
Why do we need IC? Answer: Particularly in HPC, it is not easily possible to provide curing water from the top surface (for example) at the rate that is required to satisfy the ongoing chemical shrinkage, due to the extremely low permeabilities that are often achieved in the concrete as the capillary pores depercolate. Capillary pore percolation/depercolation first noted by Powers, Copeland and Mann (PCA-1959).
How does IC work? Answer: IC distributes the extra curing water (uniformly) throughout the entire 3-D concrete microstructure so that it is more readily available to maintain saturation of the cement paste during hydration, avoiding self-desiccation (in the paste) and reducing autogenous shrinkage. Because the autogenous stresses are inversely proportional to the diameter of the pores being emptied, for IC to do its job, the individual pores in the internal reservoirs should be much larger than the typical sizes of the capillary pores (micrometers) in hydrating cement paste and should also be well connected (percolated).
Cement paste Water reservoir
Blended Cements • Internal curing can be particularly important in high-performance (low w/cm) blended cement systems • Increased chemical shrinkage of pozzolanic and slag reactions • Cement: 0.06 to 0.07 mL/g cement • Silica fume: 0.22 mL/g cement • Slag: ~ 0.18 mL/g cement • Fly ash (Type F): ~ 0.12 to 0.16 mL/g cement • Possible earlier depercolation of capillary pores and reduced permeability limiting water transport distances within the hydrating blended cement paste microstructure
Autogenous Deformation Results IC added via fine LWA to increase total “w/c” from 0.30 to 0.38 or 0.40 Note – chemical shrinkage of pozzolanic reaction of silica fume with CH is ~0.22 g water/g silica fume or about 3.2 times that of cement
Autogenous Deformation Results IC added via fine LWA to increase total “w/c” from 0.30 to 0.38 Note – chemical shrinkage of slag hydraulic reactions is ~0.18 g water/g slag or about2.6 times that of cement
“Undercuring” with Internal Curing • Hydrating cement paste is a complex and dynamic porous media and as such, internal curing mixture proportions that supply only part of the total needed water (demand) can potentially exhibit some interesting results as illustrated in the schematic on the following slide
Empty and Full Pores Saturated curing Sealed curing Less hydration Largest pores in paste empty RH = 98 % RH = 93 % Cement paste Cement paste Sufficient Internal curing Better hydration Only pores in reservoirs empty RH = 97 % Cement paste IC Reservoir Insufficient Internal curing Some increase in hydration Pores in both reservoirs and paste empty RH = 90 % IC Reservoir Cement paste
Four-Dimensional X-ray Microtomography • X-ray microtomography allows direct observation of the 3-D microstructure of cement-based materials • Example: Visible Cement Data Set http://visiblecement.nist.gov • In October 2005, experiments were conducted at Pennsylvania State University to monitor three-dimensional water movement during internal curing of a high-performance mortar over the course of two days (time is the 4th dimension)
Mixture Proportions w/c = 0.35 Blend of four sands (Ferraris) to improve particle packing LWA added in saturated surface dry (SSD) condition SSD specific gravity of 1.7 Commercial cement – no particles larger than 30 μmdiameter Hydration conducted at 30 oC maintained by circulating fluid from a temperature controlled bath
After mixing 1 d hydration 2 d hydration All images are 13 mm by 13 mm Aqua indicates drying Red indicates wetting Subtraction: 1 d – after mixing
Four-Dimensional X-ray Microtomography 2-D image with water evacuated regions (pores) overlaid on original microstructure (4.6 mm by 4.6 mm) Three-dimensional subtracted image of 1 d hydration – initial microstructure showing water-filled pores that have emptied during internal curing (4.6 mm on a side)
Quantitative Analysis • Four-dimensional image sets analyzed to estimate volume of water moving from LWA to cement paste during first 2 d of hydration • Analysis based on changes in greylevel histogram with time • Results compared to conventional measures of hydration including chemical shrinkage, non-evaporable water content, and heat release
Preprocessing of 3-D Image Data Median filter applied to remove noise and sharpen greylevel histogram
Temporal Analysis of Greylevel Histograms Change in “empty” pores with time quantified
Tomography Water Movement vs. Hydration Measures Good ”quantitative” agreement between estimated water movement volume and other measures of hydration
Four-Dimensional X-ray Microtomography Empty porosity within LWA from analysis of 3-D microtomography data sets scales “exactly” with measured chemical shrinkage of the cement for first 36 h of curing
Mixture Proportioning for Internal CuringQuestions to Consider When Using IC • How much water (or LWA) do I need to supply for internal curing? • How far can the water travel from the surfaces of the internal reservoirs? • How are the internal reservoirs distributed within the 3-D concrete microstructure? Answers May be found at the NIST internal curing web site:http://ciks.cbt.nist.gov/lwagg.html
How much water (or LWA) do I need to supply for internal curing? Answer: Equation for mixture proportioning (Menu selection #1) MLWA =mass of (dry) LWA needed per unit volume of concrete Cf =cement factor (content) for concrete mixture CS =(measured via ASTM C 1608-05 or computed) chemical shrinkage of cement αmax =maximum expected degree of hydration of cement, [(w/c)/0.36] or 1 S =degree of saturation of LWA (0 to 1] when added to mixture øLWA = (measured) absorption of lightweight aggregate (use desorption measured at 93 % RH (potassium nitrate saturated salt solution) via ASTM C 1498–04a)
How far can the water travel from the surfaces of the LWA? Answer: Equation balancing water needed (hydration) vs. water available (flow) (Menu selection #2) “Reasonable” estimates --- early hydration ---- 20 mm middle hydration --- 5 mm late hydration --- 1 mm or less “worst case” --- 0.25 mm (250 μm) Early and middle hydration estimates in agreement with x-ray absorption-based observations on mortars during curing
How are the internal reservoirs distributed within the 3-D concrete microstructure? 10 mm by 10 mm Answer: Simulation using NIST Hard Core/Soft Shell (HCSS) Computer Model (Menu selections #3 and #4) Returns a table of “protected paste fraction” as a function of distance from LWA surface Yellow – Saturated LWA Red – Normal weight sand Blues – Pastes within various distances of an LWA Mortar from μCT experiment 97 % of paste within 2 mm of LWA
Summary • Internal curing especially critical in high performance blended cement systems • Too little internal curing can actually result in a lower internal RH than in a system with no internal curing • X-ray microtomography can be used to “observe” water movement during internal curing in four dimensions • Internet tools exist to assist in mixture proportioning for internal curing