Download
1 / 1
10 likes | 184 Vues
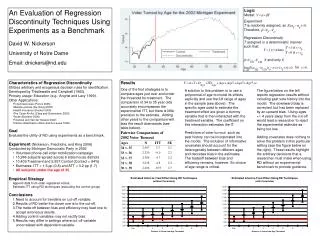
Logic Model:. Experiment T is randomly assigned, so. Therefore,. Regression Discontinuity T assigned in a deterministic manner such that:. if and only if. for. An Evaluation of Regression Discontinuity Techniques Using Experiments as a Benchmark. David W. Nickerson

E N D
Logic Model: Experiment T is randomly assigned, so . Therefore, . Regression Discontinuity T assigned in a deterministic manner such that: . if and only if for . An Evaluation of Regression Discontinuity Techniques Using Experiments as a Benchmark David W. Nickerson University of Notre Dame Email: dnickers@nd.edu • Characteristics of Regression Discontinuity • Utilizes arbitrary and exogenous decision rules for identification. • Developed by Thistlewaite and Campbell (1960). • Primary usage: Education (e.g., Angrist and Lavy 1999). • Other Applications: • Foreclosure laws (Pence 2006) • Welfare policies (De Giorgi 2005) • Health insurance (Decker 2005) • The Clean Air Act (Chay and Greenstone 2005) • Taxes (Buettner 2006) • Financial aid (Van der Klaauw 2002) • Inmate classification (Berk and de Leeuw 1999). Results One of the first strategies is to compare ages just over and under the threshold for treatment. The comparison of 34 to 35 year olds accurately encompasses the experimental ITT, but there is little precision to the estimate. Adding other years to the comparison will bias the result downwards (see table below). A solution to this problem is to use a polynomial of age to model its effects explicitly and use the full range of ages in the sample (see above). The specific ages used to estimate the treatment effect are given a dummy variable that is then interacted with the treatment variable. The coefficient on this interaction estimates the IT. Predictors of voter turnout such as past history can be incorporated into the model. The inclusion of informative covariates should account for the heterogeneity between different ages and decrease bias in the estimates. The tradeoff between bias and efficiency remains, however. So choice of age range is critical. The figure below on the left reports regression results without including past vote history into the model. The downward bias is corrected, but has been replaced by an upward bias. Using ages +/- 4 years away from the cut-off would lead a researcher to reject the experimental estimate as being too low. Adding covariates does nothing to solve the problem in this particular setting (see the figure below on the right). These results highlight the arbitrary decisions that a researcher must make when using RD without an experimental benchmark to provide guidance. • Goal • Evaluate the utility of RD using experiments as a benchmark. • Experiment (Nickerson, Friedrichs, and King 2006) • Conducted by Michigan Democratic Party in 2002 • Volunteer phone call voter mobilization campaign • 15,966 subjects spread across 6 state house districts • 10,409 Treatment and 5,557 Control (Contact = 64%) • Estimates: ITT = 1.6 pp (0.8) and ATT = 3.2 pp (1.7) • All subjects under the age of 35. • Empirical Strategy • Append data from older registered voters. • Estimate ITT using RD techniques (excluding the control group). • Conclusions • Need to account for trendline on cut-off variable. • Results of RD better the closer one is to the cut-off. • The trade-off between bias and efficiency may lead one to accept erroneous results. • Adding control variables may not rectify bias. • Results may differ in settings where cut-off variable uncorrelated with dependent variable.