Download
1 / 2
20 likes | 99 Vues
Nutrient Analysis Averaged over the course of a week, lunch menus offered in our schools provide the following:. Hardin County. Actual. Nutrient. % of Target*. Calories. 101%. 697. Iron (Mg). 113%. 4.1 Mg. School District. Calcium (Mg). 117%. 366 Mg. 205%. 502 RE.

E N D
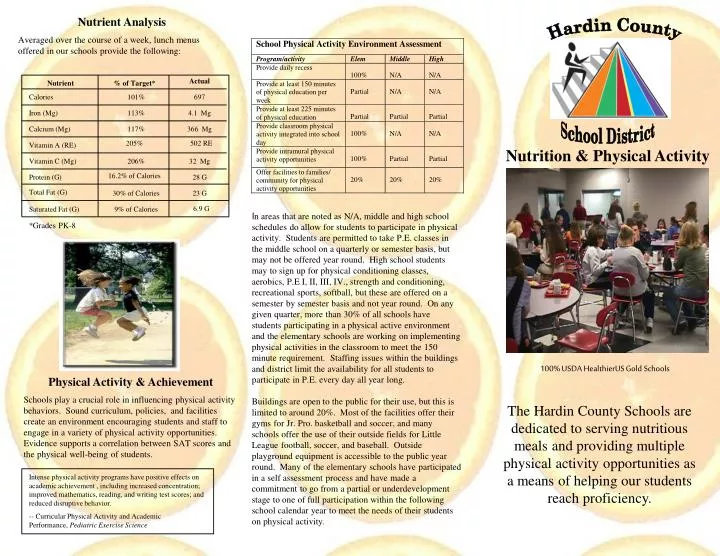
Nutrient Analysis Averaged over the course of a week, lunch menus offered in our schools provide the following: Hardin County Actual Nutrient % of Target* Calories 101% 697 Iron (Mg) 113% 4.1 Mg School District Calcium (Mg) 117% 366 Mg 205% 502 RE Vitamin A (RE) Nutrition & Physical Activity Report Card 2006 Vitamin C (Mg) 206% 32 Mg 16.2% of Calories Protein (G) 28 G Total Fat (G) 30% of Calories 23 G 6.9 G Saturated Fat (G) 9% of Calories In areas that are noted as N/A, middle and high school schedules do allow for students to participate in physical activity. Students are permitted to take P.E. classes in the middle school on a quarterly or semester basis, but may not be offered year round. High school students may to sign up for physical conditioning classes, aerobics, P.E I, II, III, IV., strength and conditioning, recreational sports, softball, but these are offered on a semester by semester basis and not year round. On any given quarter, more than 30% of all schools have students participating in a physical active environment and the elementary schools are working on implementing physical activities in the classroom to meet the 150 minute requirement. Staffing issues within the buildings and district limit the availability for all students to participate in P.E. every day all year long. Buildings are open to the public for their use, but this is limited to around 20%. Most of the facilities offer their gyms for Jr. Pro. basketball and soccer, and many schools offer the use of their outside fields for Little League football, soccer, and baseball. Outside playground equipment is accessible to the public year round. Many of the elementary schools have participated in a self assessment process and have made a commitment to go from a partial or underdevelopment stage to one of full participation within the following school calendar year to meet the needs of their students on physical activity. *Grades PK-8 100% USDA HealthierUS Gold Schools Physical Activity & Achievement Schools play a crucial role in influencing physical activity behaviors. Sound curriculum, policies, and facilities create an environment encouraging students and staff to engage in a variety of physical activity opportunities. Evidence supports a correlation between SAT scores and the physical well-being of students. The Hardin County Schools are dedicated to serving nutritious meals and providing multiple physical activity opportunities as a means of helping our students reach proficiency. Intense physical activity programs have positive effects on academic achievement , including increased concentration; improved mathematics, reading, and writing test scores; and reduced disruptive behavior. -- Curricular Physical Activity and Academic Performance, Pediatric Exercise Science
National School Lunch The National School Lunch Program (NSLP) was conceived in 1946 as a “measure of national security to safeguard the health and well-being of the Nation’s children.” School districts receive federal reimbursement for each school lunch served that meets the United States Department of Agriculture nutrition guidelines. These guidelines promote meal quality while commodity donations help the farmer and help schools keep down meal prices. Our lunch meals are planned on a four-week menu cycle. Federal regulations require that we offer minimum portion sizes of meat, fruit and/or vegetable, grains/breads and fluid milk during every lunch meal service. The portion sizes are designed to meet the needs of growing children and, as a rule, we increase the sizes as the children grow older. We offer whole grains and fresh fruits and vegetables daily. Students are allowed to serve themselves all the fresh fruits and vegetables they will eat. The menu cycle provides for variety and allows us to make the most efficient use of the donated commodities, especially seasonal fresh fruits.We offer 1% and skim milk, as well as 100% fruit and vegetable juices. An analysis of our lunch menus is found elsewhere in this report card. The table below provides a synopsis of the lunch program, including participation and financial data. School Breakfast The School Breakfast Program (SBP) was established in 1966. School districts receive federal reimbursement for each school breakfast served that meets the U.S. Department of Agriculture’s nutrition guidelines. Studies show that children who participate in the School Breakfast Program have significantly higher standardized achievement test scores than non-participants. Children with access to school breakfast also had significantly reduced absence and tardiness rates. “Protecting children’s health and cognitive development may be the best way to build a strong America.” -- Dr. J. Larry Brown, Tufts University School of Nutrition Food and beverage items that are sold as extras on the cafeteria lines or through vending machines all meet the minimum nutritional standards required by the Kentucky Board of Education. These standards are designed to limit access to items with little or no nutrient density. No sales or service of foods take place until 30 minutes after the lunch period ends in elementary and middle schools. Only 100% juice, unflavored water, and lowfat milk is sold in vending at the high school level. After-School Snack Program The After-School Snack Program allows after-school care programs with regularly scheduled activities in an organized, structured environment to provide and claim reimbursement for snacks served to school-age children. A USDA study showed students who eat school meals are more likely to consume milk, meats, grain mixtures and vegetables compared to students who did not, including students who brought meals from home. Also, students who eat school meals have higher intakes of some vitamins and minerals, including calcium and Vitamin A -- nutrients that tend to be “problem nutrients” for kids. Cost-wise, schools work very hard to make sure that school meals are a good value. Take a look at the number of items typically offered to students at lunch -- an entrée, two servings of fruits and vegetables, a bread or grain item and 8 ounces of milk. It takes a real balancing act to beat that value with a bag lunch. --National Dairy Council