Capturing and Using Knowledge about Visualization Toolkits
Capturing and Using Knowledge about Visualization Toolkits. Nicholas Del Rio Paulo Pinheiro - PNNL. Outline. Discovery through Visualization Diversity Background on Generating Visualizations Visualization Conceptual Model Visualization Knowledge Base A Practical Application Conclusion.

Capturing and Using Knowledge about Visualization Toolkits
E N D
Presentation Transcript
Capturing and Using Knowledge about Visualization Toolkits Nicholas Del Rio Paulo Pinheiro - PNNL
Outline • Discovery through Visualization Diversity • Background onGenerating Visualizations • Visualization Conceptual Model • Visualization Knowledge Base • A Practical Application • Conclusion
Service Discovery for Visualization There are many ways to visualize a single dataset Near neighbor vs. surface gridding techniques 3D views: isosurfaces vs. point plot In many cases, it is up to the users to understand the different views and know how to generate them
Service Discovery for Visualization There are many ways to visualize a single dataset Near neighbor vs. surface gridding techniques 3D views: isosurfaces vs. point plot How can we support the seamless automated discovery of visualization services to support visualization diversity?
Goal Enable automated discovery and integration of visualization services Objectives: VISUALIZE http://cs.utep.edu/dataX.xyz AS isosurfaces IN firefox WHERE FORMAT = csv AND TYPE = gravity AND interval = 5 AND xRotation = 10 1 Abstract visualization pipelines in the form of declarative requests (visualization queries) 2 Construct a knowledge base of visualization services 3 Develop methods for translating the abstractions into pipelines (query answering)
Proposed Usage Pattern Users may also generate other visualizations of the same datasetfrom a variety of sources
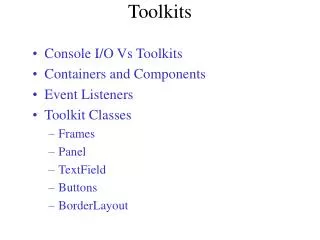
Background Users typically employ visualization toolkits to construct visualizations Sequence of visualization operators known as a pipeline
Visualization Pipeline Structure Op 1 Op1: vtkDataObjectToDataSetFilter Data Gathering 1 Op 2 Op2: vtkShepardMethod Mapping 2 Op 3 Op 3: vtkExtractVOI Op 4 3 Visualization Abstraction Op 4: vtkContourFilter specified in the query Op 5 Rendering 4 Op 5: vtkPolyDataMapper 4 3 2 1 2 Data Flow Model – Haber and McNabb 90 Data State Model – Chi 98
Building From Existing Work Haber’s work paved the way for modular visualization environments popular in the 90’s: • Visualization Data Explorer (OpenDX) and IRIS • A Visualization System (AVS) and Visualization Toolkit (VTK) • Users still have to manually compose pipelines Chi’s work provided a data centric perspective from which to compare and taxonomize techniques These models have not been used to drive automatic composition of visualization pipelines
Building From Existing Work (2) Past efforts to automate visualization generation have had great success in restricted domains: • A Presentation Tool (APT) – Jock Mackinlay 86 • Tableau – Stolte 2012 Both operate on relational data to drive visualizations: • Nominal or ordinal • Functionally dependent These tools were not designed to operate on general kinds of data and are were more focused towards information visualization
Our Enhancements: Format [Type] One way we expand on existing visualization models is by considering type and format requirements of modules. We call these modules transformers CSV [Gravity] OBSERVATION 1 Op 1 Format is not enough, some can encode a variety of types XML [vtkPolyData] Op 2 OBSERVATION 2 XML [vtkImageData3D] Dimension reduction is not explicitly specified but inferred through the type requirements Op 3 XML [vtkImageData2D] Op 4 OBSERVATION 3 These formats and types should be defined in ontologies and shared to foster interoperability XML [vtkPolyData] Op 5 JPEG [owl:Thing]
Our Enhancements: Viewer We also consider the viewer that presents the visualization Op 1 Op 2 After the mapping, there may be a number of transformations before the geometry can be presented by a viewer Op 3 Op 4 These additional transformations may be viewed as an expansion of the rendering phase JPEG [owl:Thing] PDF [owl:Thing] Op 5 Op 6 PDF Viewer (Type Agnostic)
Our Overall Model • Marries Data Flow (Haber) with Data State (Chi) concept of Visualization Abstraction • Incorporates service composition concerns (i.e., format [type]) into data gathering phase • Incorporates concept of a Viewer • Expands rendering phase to consist of a sub pipeline of further transformations • Is encoded in OWL
Constructing the Knowledge Base • We can classify visualization services using the concepts in our ontology: • Transformer • Mapper (generates visualization abstractions) • Viewer • Services are combined based on our model constraints: • Format[type] match-ups • Must include a mapper • Must terminate at a viewer Transformer Mapper Viewer
Answering Visualization Queries • Visualization Queries Specify: • Source format[type] • Target Visualization Abstraction • Target Viewer VISUALIZE http://somedata.csv AS 3d-point-plot IN firefox WHERE FORMAT = csvAND TYPE = gravity-data Transformer Mapper Viewer
Sharing Visualizations Recipient may be unable to adjust any properties such as contour interval, color tables, projection and labels 1. Send image (contents or by URL) Recipient may not have tools, capabilities, and expertise to regenerate visualization from data 2. Send data These solutions have been implemented only for specific domains , for example OGC 3. Send URL of visualization embedded in viewer VisKo queries address the limitations above 4. Send a VisKo Query specifying the visualization
Conclusion • Visualization queries abstract away the complexities of visualization pipelines. • We can automate pipeline construction provided: • A visualization query • A service knowledge base structured using our model • We can use queries to share visualizations in a way that empowers visualization recipients.
Future Work • Automated Parameter Settings • Color functions driven from formula identification • Data driven vs. visualization driven • Weighted graphs • Add information about performance • Add information about quality degradation • Task driven generation • Map task descriptions (Shneiderman 96) to the right set of parameters and visualization abstractions
Play With Our System! http://trust.utep.edu/visko http://iw.cs.utep.edu/visko-web: VisKo Server