PHYS 2022: Observational Astronomy
870 likes | 1.05k Vues
PHYS 2022: Observational Astronomy. Astronomical Spectroscopy . Learning Objectives. Spectroscopy: - spectrum - spectrograph or spectrometer

PHYS 2022: Observational Astronomy
E N D
Presentation Transcript
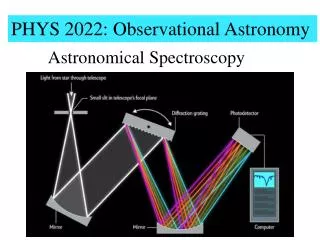
PHYS 2022: Observational Astronomy Astronomical Spectroscopy
Learning Objectives • Spectroscopy: - spectrum - spectrograph or spectrometer • Spectral Lines: - electron orbits and energy levels in atoms - emission and absorption of photons - energy levels and spectrum of hydrogen atoms and hydrogen-like ions - naming spectral lines - permitted and forbidden transitions - other ways for atoms/molecules/ions to produce spectral lines • Continuum and Spectral Line Formation: - Kirchoff’s laws - absorption lines - emission lines- continuous emission
Learning Objectives • Spectrometers or Spectrographs: - objective prism - slit spectroscopy - diffraction grating - line grating - blazed grating - spectral resolution - echelle grating - multi-object spectrographs - integral field spectrographs • Spectral Line Profiles and Shifts: - natural broadening - pressure broadening - Doppler effect - thermal or Doppler broadening
Learning Objectives • Slit Spectroscopy: - setup and observations - data reduction - extracting spectrum - wavelength calibration - extinction correction - flux calibration - removing sky lines
Learning Objectives • Spectroscopy: - spectrum - spectrograph or spectrometer • Spectral Lines: - electron orbits and energy levels in atoms - emission and absorption of photons - energy levels and spectrum of hydrogen atoms and hydrogen-like ions - naming spectral lines - permitted and forbidden transitions - other ways for atoms/molecules/ions to produce spectral lines • Continuum and Spectral Line Formation: - Kirchoff’s laws - absorption lines - emission lines - continuous emission
Spectroscopy and Spectrum • Spectroscopy is the act of measuring the energy output rate (flux density) from a (celestial) object as a function of wavelength or frequency so as to study its spectral lines. • Plot of the flux density vs wavelength or frequency is the spectrum of the object. • What can we learn from measuring the spectra of celestial objects? Flux Density (10-8 erg cm-2 s-1 Å-1)
Spectrograph or Spectrometer • Conversion between expressing flux density in wavelength and frequency Fλ= (ν2/c)Fν • To measure spectra, we use a spectrograph or spectrometer to separate the incoming radiation into its component wavelengths. • Common wavelength separator: prism, diffraction grating, grism (grating + prism).
Learning Objectives • Spectroscopy: - spectrum - spectrograph or spectrometer • Spectral Lines: - electron orbits and energy levels in atoms - emission and absorption of photons - energy levels and spectrum of hydrogen atoms and hydrogen-like ions - naming spectral lines - permitted and forbidden transitions - other ways for atoms/molecules/ions to produce spectral lines • Continuum and Spectral Line Formation: - Kirchoff’s laws - absorption lines - emission lines - continuous emission
Electron Orbits and Energy Levels • In atoms, electrons can only prescribe certain orbits around the atomic nucleus. Electrons in different orbits can have the same or entirely different energies. • Each electronic orbit therefore defines an energy level of the atom. A given energy level can be degenerate (i.e., comprising different orbital configurations.)
Electron Orbits and Energy Levels • Figure below shows the energy level diagram for the hydrogen atom. At n = ∞, the electron has the highest potential energy but no kinetic energy. At n < ∞, the energy of the electron is a sum of its potential and kinetic energy.
Emission of Photons • An electron in an atom can make a transition from a higher to lower energy level, emitting a photon with an energy equal to the energy difference between the two energy levels. An emission line is produced.
Absorption of Photons • A photon with the appropriate energy can be absorbed by and therefore excite an electron in an atom to make a transition from a lower to higher energy level. An absorption line is produced. • A photon with a sufficiently high energy can excite an electron from a bound to free state, thus ionizing an atom. What is the energy required to ionize the hydrogen atom in the ground state?
Electron Transitions • Every atom, ion, and molecule has a unique spectroscopic signature which depends on its electron orbital structure and possible electron transitions. • E.g., Some possible transitions of excited hydrogen.
Electron Transitions • Spectral lines of atomic hydrogen.
Electron Transitions • Spectral lines at optical wavelengths produced by selected atoms.
Energy Levels of Hydrogen Atom • Energy levels of the hydrogen atom: • where n = principle quantum number. (μ = reduced mass of the electron, e = electronic charge, ħ = h/2π where h = Planck’s constant.) • Ground state: n = 1. • Excited states: n = 2, 3, … • n = ∞ and continuum states correspond to ionized (free) states. -1.51 eV • Transition of an electron from the mth to nth energy level will require a photon of wavelength: • where RH = Rydberg constant = 1.10x10⁷ m-1. -3.4 eV -13.6 eV
Energy Levels of Hydrogen Atom • Energy levels of the hydrogen atom: • where n = principle quantum number. (μ = reduced mass of the electron, e = electronic charge, ħ = h/2π where h = Planck’s constant.) • Ground state: n = 1. • Excited states: n = 2, 3, … • n = ∞ and continuum states correspond to ionized (free) states. -1.51 eV • Transition of an electron from the nth to mth energy level will result in a photon of wavelength: • where RH = Rydberg constant = 1.10x10⁷ m-1. -3.4 eV -13.6 eV
Spectral Lines of Hydrogen Atom • Emission lines are produced when electrons make transitions from higher to lower energy levels and emit photons. (A given transition by a single electron results in the emission of a single photon having an energy equal to the energy difference between the energy levels.) • Absorption lines are produced when electrons absorb photons to make transitions from lower to higher energy levels. (A given transition by a single electron requires a single photon having an energy equal to the energy difference between the energy levels.)
Spectral Lines of Hydrogen Atom • Lyman series correspond to transitions from or to the ground (n = 1) state, requiring or emitting UV photons. • Balmer series correspond to transitions from the first excited (n = 2) to a higher state, or from a higher to the first excited state, requiring or emitting optical photons.
Spectral Lines of Hydrogen Atom • Paschen series correspond to transitions from the second excited (n = 3) to a higher state, or from a higher to the second excited state, requiring or emitting near-infrared photons. • Followed by the Brackett, Pfund, and Humphreys series in the near-infrared to mid-infrared.
Naming Spectral Lines of Hydrogen • Individual spectral lines of hydrogen are identified by the series to which they belong.
Naming Spectral Lines of Hydrogen • Wavelengths of Lyman series lines. Lyman limit corresponds to n= 1 → ∞.
Naming Spectral Lines of Hydrogen • Wavelengths of Lyman series lines. Lyman limit corresponds to n= 1 → ∞.
Naming Spectral Lines of Hydrogen • Wavelengths of Balmer series lines. Balmer limit corresponds to n= 2 → ∞.
Naming Spectral Lines of Hydrogen • Recall from the last chapter that the sharp drop-off at the Balmer limit can be used to estimate the redshifts of galaxies. (Notice the shift in wavelength of the Balmer limit with increasing redshifts.)
Energy Levels of Hydrogen-like Ions • Atoms which are ionized to the stage where they only have one electron remaining – hydrogen-like or hydrogenic ions – have an energy-level pattern similar to that of hydrogen (but the energy levels do not have the same energies as those of hydrogen). Singly-ionized Helium Hydrogen
Naming Spectral Lines of Hydrogen-like Ions • Atoms which are ionized to the stage where they only have one electron remaining – hydrogen-like or hydrogenic ions – have an energy-level pattern similar to that of hydrogen (but the energy levels do not have the same energies as those of hydrogen). • Hydrogen-like ions therefore exhibit spectra that have a pattern similar to hydrogen (except that the lines are not at the same wavelengths as hydrogen). • The individual spectral lines of hydrogen-like ions are identified by the series to which they belong just like for hydrogen. • E.g., Ly-α line of singly-ionized helium at a wavelength of 304 Å.
Naming Spectral Lines of other Atoms/Ions • For all other emission lines, they are identified by the species and its wavelength. • E.g., neutral oxygen (O) is O I, singly-ionized oxygen (O+) is O II, doubly-ionized oxygen (O2+) is O III, etc. • E.g., a particular line of OI at 5577Å is referred to as O I λ 5577Å. • Furthermore, transitions between different energy levels have different probabilities of occurring. E.g., for hydrogen, a transition between n = 3 → 1 has a factor of nearly 8 times higher probability than between n = 3→ 2. • Transitions that have a high probability of occurring are known as permitted transitions; i.e., electrons spend relatively little time at the higher energy level before transitioning to the lower energy level.
Naming Spectral Lines of other Atoms/Ions • For all other emission lines, they are identified by the species and its wavelength. • E.g., neutral oxygen (O) is O I, singly-ionized oxygen (O+) is O II, doubly-ionized oxygen (O2+) is O III, etc. • E.g., a particular line of OI at 5577Å is referred to as O I λ 5577Å. • Furthermore, transitions between different energy levels have different probabilities of occurring. E.g., for hydrogen, a transition between n = 3 → 1 has a factor of nearly 8 times higher probability than between n = 3→ 2. • Transitions that have a low probability of occurring are known as forbidden transitions; i.e., electrons spend a relatively long time at the higher energy level before transitioning to the lower energy level. Lines corresponding to forbidden transitions are denoted by []; e.g., [O III] λ 5007Å. Lines from forbidden transitions are not seen from gases on the Earth but seen from gases in interstellar space.
Naming Spectral Lines of other Atoms/Ions • Examples of permitted and forbidden lines in the spectrum of the Orion nebula.
Other Ways to Produce Spectral Lines • Transitions between different orbitals of an electron are not the only way to produce spectral lines. • E.g., the 21-cm line of atomic hydrogen is produced by transitions between different spin alignments of the electron and proton in the ground state of hydrogen.
Other Ways to Produce Spectral Lines • Transitions between different orbitals of an electron are not the only way to produce spectral lines. • Molecules can rotate at certain prescribed rotational frequencies, and vibrate at certain prescribed vibrational frequencies. Transitions between different rotation states at the same vibrational states are known as rotational transitions, and between the same or different rotational states at different vibrational states are known as rotational-vibrational transitions.
Learning Objectives • Spectroscopy: - spectrum - spectrograph or spectrometer • Spectral Lines: - electron orbits and energy levels in atoms - emission and absorption of photons - energy levels and spectrum of hydrogen atoms and hydrogen-like ions - naming spectral lines - permitted and forbidden transitions - other ways for atoms/molecules/ions to produce spectral lines • Continuum and Spectral Line Formation: - Kirchoff’s laws - absorption lines - emission lines- continuous emission
Kirchoff’s Laws • In the mid-19th century, based on experiments Kirchoff summarized his three empirical laws under which spectral lines were produced:
Kirchoff’s Laws • To understand the physical basis of Kirchoff’s laws, know that an atom/ion/molecule can be excited either by the absorption of photons or collisions with another particle (which absorbs a part or all of kinetic energy of the colliding particle). • Similarly, an atom/ion/molecule can be de-excited either by the emission of photons or collisions with another particle (which excites the colliding particle or adds to its kinetic energy).
Absorption Lines • What is the physical explanation for the following Kirchoff’s law?
Emission Lines • What is the physical explanation for the following Kirchoff’s law?
Photospheric Absorption Lines • Spectral lines from stellar photospheres are seen in absorption. Why?
Photospheric Absorption Lines • Spectral lines from stellar photospheres are seen in absorption. Why?
Continuous Emission • What is the physical explanation for the following Kirchoff’s law.
Forbidden Lines • Forbidden lines are are not seen from gases on the Earth, but seen from gases in interstellar space. Forbidden lines can be just as bright if not brighter than permitted lines. • Recall that forbidden lines have low transition probabilities; i.e., electrons spend a relatively long time at the higher energy level before transitioning to the lower energy level. Why are forbidden transitions not seen from gases on the Earth but seen from gases in interstellar space?
Learning Objectives • Spectrometers or Spectrographs: - objective prism - slit spectroscopy - diffraction grating - line grating - blazed grating - spectral resolution - echelle grating - multi-object spectrographs - integral field spectrographs • Spectral Line Profiles and Shifts: - natural broadening - pressure broadening - Doppler effect - thermal or Doppler broadening
Measuring Spectra • There are a number of ways in which the spectra of celestial objects can be measured. • One way is to place a prism just in front of the the telescope objective, known as an objective prism.
Measuring Spectra • An example of objective prism spectra of the Hyades open star cluster. • What are the advantages and disadvantages of objective prism surveys?- spectra of all objects can be measured in a single exposure - spectra of different objects can overlap • In this course, we consider spectrographs using diffraction gratings.
Spectrograph • Basic components of a spectrograph are: - entrance aperture, which can be a slit or circular apertures (optical fibers) - collimator, which is an optical element to make light parallel and hence have the same angle of incidence over the surface of the dispersing element - dispersing element (e.g., prism), which separates light to different wavelengths - spectrum imager, which focuses the spectrum onto a detector - detector, which in modern times is a CCD
Slit Spectroscopy • If you are measuring the spectrum of one object that is unresolved or in its entirety, it would not matter what shape aperture you use so long as the aperture only lets through light from that object.
Slit Spectroscopy • What if you want to measure the spectrum as a function of position in an extended object? One way is to use a slit, which of course restricts the spectrum to just locations along the slit. slit orientation position λ
Diffraction Gratings • A diffraction grating is a collection of equally spaced transmitting or reflecting elements (grooves) separated by a distance comparable to the wavelength of light. • A simple diffraction grating consists of lines (opaque to light) scratched onto a glass surface, so that only the smooth surface transmits (transmission grating) or reflects (reflection grating) light.
Line Gratings • A simple transmission (line-diffraction) grating. Only 2 grating apertures are shown in this example; in practice, there can be many thousands of grating apertures. • Maxima occur when the path difference between adjacent rays, d sin θ, is an integer multiple of the wavelength, λ, of light. m = 2 m = 1 m = 0 m = -1 m = -2 mλ (m – ½ ) λ