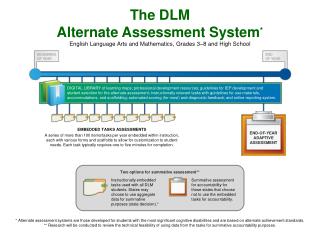
2015 NCSC Alternate Assessment Results in English language arts and Mathematics
2015 NCSC Alternate Assessment Results in English language arts and Mathematics. Heather Heineke, Assessment Specialist Office of Curriculum, Instruction, and Assessment. Topics:. Alternate Assessment Performance Level Descriptors Sample Items for ELA and mathematics Data from the LCI

2015 NCSC Alternate Assessment Results in English language arts and Mathematics
E N D
Presentation Transcript
2015 NCSC Alternate Assessment Results in English language arts and Mathematics Heather Heineke, Assessment Specialist Office of Curriculum, Instruction, and Assessment
Topics: • Alternate Assessment • Performance Level Descriptors • Sample Items for ELA and mathematics • Data from the LCI • Communication and Expressive Language • The difference in proficiency levels between general education and alternate assessments • Opportunity to Learn • Where teachers are confident • What teachers focus on (and what they don’t) over the grades • How students are engaged in their learning • What does this tell us about education for students who take the alternate assessment.
Registration and Training • MSAA (formerly NCSC) (January, 2016) • in-person training session or • online, self-paced modules. • Final quiz required. All educators will take the 2016 quiz; regardless of whether they administered the test in 2015. • Student registration at district level (Jan-Feb, 2016) • RIAA Science all training is complete; materials are available at www.ride.ri.gov. • 2015-16 RIAA Training Presentation, • 2015-16 RIAA Science Test Administration Manual • Additional materials relating to three science investigations. • No quiz required to administer the RIAA Science assessment. • Student registration open now.
Performance Level Setting and Descriptors • Educators from all of the NCSC states participated in performance level setting this summer • NCSC has 4 performance levels. Students at Levels 3 and 4 meet or exceed expectations. • Two Types of PLDs • Paragraphs for student reports sent to parents • Detailed charts that contain specific skills and knowledge by level. • Outline the ways item complexity and text complexity develops across the tiers of items.
3rd Grade Mathematics ExamplePage 14: Mathematics Core Content Connectors (CCC) • CCSS 3.NF.1: Understand a fraction 1/b as the quantity formed by 1 part when a whole is partitioned into b equal parts; understand a fraction a/b as the quantity formed by a parts of size 1/b. • CCC 3.NO.1l3: Identify the fraction that matches the representation (rectangles and circles; halves, fourths, and thirds, eighths).
Mathematics Grade 3 Sample ItemThis sample item is an example of a lower tier This item begins with a model telling the student what the item is about: The model is followed by the item. This item has two answer options instead of three. :
6th Grade Mathematics: CCSS and CCCPage 27: Mathematics Core Content Connectors (CCC) • CCSS 6.RP.1: Understand the concept of a ratio and use ratio language to describe a ratio relationship between two quantities. For example, “The ratio of wings to beaks in the bird house at the zoo was 2:1, because for every 2 wings there was 1 beak.” “For every vote candidate A received, candidate C received nearly three votes.” • CCC 6.PRF.1c1: Describe the ratio relationship between two quantities for a given situation.
Grade 6 Mathematics sample item This item begins by telling the student what the item is about. Then it provides a context that includes visual supports: This item is a continuation of the context and each answer option includes visual supports.
Less Complex More Complex Most Complex • Compound and complex sentences • Grade level words • Theme implied • Connections between a range of ideas and events • Charts and tables essential to understand text • Answers inferred from the text • Simple and compound sentences • Some grade level words • Theme is clear • Connections between ideas and events presented in order • Charts and tables • Answers drawn from the text • Simple sentences • Commonly used words • Theme is obvious • Clear events in order • Predictable events • Simple charts and tables • Answers taken from the text Text Complexity of Reading PassagesAlso see Performance Level Charts in Interpretation Guide
4th Grade ELA: CCSS and CCCPage 9: ELA Core Content Connectors (CCC) CCSS 4.RL 2 Determine a theme of a story, drama, or poem from details in the text; summarize the text. CCC 4.RL.k2 Determine the theme of a story, drama, or poem; refer to text to support answer. CCSS 4.RL 1 Refer to details and examples in a text when explaining what the text says explicitly and when drawing inferences from the text. CCC 4.RL.i1 Refer to details and examples in a text when explaining what the text says explicitly.
4th Grade Sample Literary Passage This sample text has simplified language, graphics to aid in understanding, and a simple story line. This passage could also be read out loud if it were included on the test.
4th Grade Sample Item A reminder of what the theme of the story is about and three answer options with visual supports. Every passage, or part of a passage, can be re-read as many times as the student would like.
4th Grade Sample Item Passage part; same passage as previous example Statement reminding students what the item is about Three answer options with visual supports. The student can re-read passage, or have it read to them, as many times as they need.
11th Grade Mathematics: CCSS and CCCPage 35 & 36: ELA Core Content Connectors (CCC) CCSS 11-12.RI.1 Cite strong and thorough textual evidence to support analysis of what the text says explicitly as well as inferences drawn from the text, including determining where the text leaves matters uncertain. CCC: 112.RI.b1 Use two or more pieces of evidence to support inferences, conclusions, or summaries from text. CCSS 11-12.RI.6 Determine an author’s point of view or purpose in a text in which the rhetoric is particularly effective, analyzing how style and content contribute to the power, persuasiveness or beauty of the text. CCC 1112.RI.d1 Determine the author's point of view or purpose in a text.
11th Grade Sample Informational Passage Visual Supports Statement telling students what they will do after they read the passage. Compound and complex sentences, some grade level words
11th Grade Sample Items Statement reminding students what the item is about Three answer options with visual supports. CCC: 112.RI.b1 Use two or more pieces of evidence to support a conclusion.
11th Grade Sample Item Statement about author’s point of view. Passage part; same passage as previous example Statement reminding student what the student just read and what the student will be looking for next • CCC 1112.RI.d1 Determine the author's point of view or purpose in a text. Three answer options with visual supports.
Baseline Data What do we know about what our students can do?
Teachers in RI reported the following about ELA: • 60% of RI students could read some text or braille • 3% of RI students read fluently with critical understanding in print or braille; • 22% of RI students could read fluently with basic, literal understanding; • 35% of RI students read basic sight words, simple sentences, directions, bullets, and/or lists in print or braille; • 19% of RI students are aware of text, makes letter distinctions, or tells a story from pictures. • 17% of RI students had no observable awareness of print or braille.
Teachers in RI reported the following in the LCI about mathematics: • 34% of RI students performed computational procedures with or without a calculator; • 30% of RI students could count with 1:1 correspondence to at least 10 or made numbered sets of items; • 11% of RI students can count by rote to 5; • 16% of RI students had no observable awareness or use of numbers
Expressive Communication 68% of RI students use symbolic language to communicate: Student uses verbal or written words, signs, Braille, or language-based augmentative systems to request, initiate, and respond to questions, describe things or events, and express refusal. 20% of RI students use intentional communication, but not at a symbolic language level: Student uses understandable communication through such modes as gestures, pictures, objects/textures, points, etc., to clearly express a variety of intentions. 9% of RI students communicate primarily through cries, facial expressions, change in muscle tone, etc., but no clear use of objects/textures, regularized gestures, pictures, signs, etc., to communicate.
Receptive Language 21% of RI students independently follow 1-2 step directions presented through words (e.g. words may be spoken, signed, printed, or any combination) and does NOT need additional cues. 54% of RI students require additional cues (e.g., gestures, pictures, objects, or demonstrations/models) to follow 1-2 step directions. 16% of RI students alert to sensory input from another person (auditory, visual, touch, movement) BUT requires actual physical assistance to follow simple directions. 2% of RI students have uncertain response to sensory stimuli (e.g., sound/voice; sight/gesture; touch; movement; smell).
Opportunity to Learn The following data is from the End of Test Survey from 2015 ELA and mathematics operational tests, which asked teachers a variety of questions about instructional time, accessibility, and frequency with which content is covered during the school year.
Gray: Percent of teachers who teach this content 7 or more times in the school year Orange: Percent of teachers who find this content accessible to their student. Blue: Percent of teachers who find this content challenging to teach.
What do we know about the education of our significantly cognitively disabled students? • Teachers are focusing on content that is most comfortable for themselves and their students. • More needs to be done to support teachers in the following areas: • Statistics & Probability • Fractions • Algebra • Ratios • Writing an argument • Across the grades, there is a lack of articulated content coverage across grade levels. • Teachers know how to engage students physically and cognitively in instruction.
NCSC Test Results The following information is confidential and not to be distributed or discussed.
Talking to Parents • NCSC was a new assessment for the 2014-15 school year and we recognize that student achievement may differ between NCSC and RIAA ELA/mathematics/writing. • RIAA ELA/mathematics measured the old Alternate Assessment Grade Span Expectations (AAGSEs) whereas NCSC measures progress toward post secondary options using our new Common Core Connectors; which are aligned to the Common Core State Standards. • We will not compare RIAA results in ELA and mathematics with the results of NCSC because they are different tests that measure different standards. • The NCSC assessments are based on higher learning standards than we have ever had before, and the assessment results will set a new baseline for us and for all states in the new MSAA (Multi-State Alternate Assessment) consortium. • NCSC assessment results should be used along with local assessment results and other information to determine what changes in curriculum and instruction may be needed to support students learning.
NCSC 2015: State Results for ELA. Percent of students at each achievement level * This is the average score students in Rhode Island received at each grade. The achievement level for that score is in parenthesis. ** Levels 3 and 4 are meeting expectations.
NCSC 2015: State Results for Mathematics. Percent of students at each achievement level * This is the average score students in Rhode Island received at each grade. The achievement level for that score is in parenthesis. ** Levels 3 and 4 are meeting expectations.