CO 2 Tool Workshop
Learn to measure CO2 emissions in transport projects at different scales and levels of accuracy, using TEEMP models and methodologies. Excel-based tools for data analysis and emission quantification. Understand impacts and potential co-benefits to improve air quality.


CO 2 Tool Workshop
E N D
Presentation Transcript
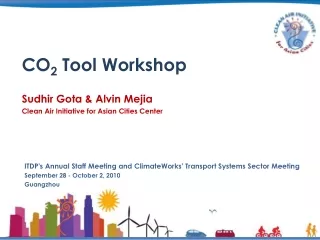
CO2 Tool Workshop Sudhir Gota & Alvin Mejia Clean Air Initiative for Asian Cities Center ITDP's Annual Staff Meeting and ClimateWorks' Transport Systems Sector Meeting September 28 - October 2, 2010 Guangzhou
How to Quantify CO2 emissions? Depends on many factors! • Scale of analysis – project, zonal, organizational, city , regional or national • Accuracy –sketch vs detailed • Project Duration? • Top down or Bottom Up? • When do want to apply this – ex-ante or ex-post? • Data availability ? • To what level of analysis or boundary – “hidden” ? “induced” ? “impact on landuse”? • Resources available? • Baseline – static or dynamic? • What do you want to do with results? • Cobenefits?
How to Quantify CO2 emissions? Source :- CAI Asia
TEEMP Models – evaluating impacts of interventions Business as Usual DESTINATION ORIGIN Intervention 1 Intervention 2 Intervention 3
TEEMP Models – Type of Interventions • Bike Improvement Projects –Bike Share and Bike lane • Walkability Improvement Projects • BRTS Projects • LRT/MRT Projects • Rural Roads Improvement • Urban Roads Improvement • Rural Expressways • Sketch Analysis of Railway Emissions • The methodology encompasses both- with and without project cases • Emissions are quantified from both Construction and Operation. And the baseline is dynamic and not static • Excel based spreadsheet models with simple input/output tables • Model provides an opportunity to quantify CO2, PM and NOx
TEEMP models are based on ASIF 6 Source :- CAI Asia
TEEMP Models – Bike Sharing System 8 Source :- ITDP Bicycle taxi feeder service at Jakarta
TEEMP Models – Bike Sharing System TRANSPORT SYSTEM CHARACTERISTICS TRAFFIC IMPACT OF THE BIKE SHARING SYSTEM INPUT DATA EMISSIONS SAVED DUE TO MODE SHIFT BIKE SHARING SYSTEM CHARACTERISTICS 9
TEEMP Models – Bike Sharing System • Inputs • Project lifetime (number of years) • Average bike trip length (kilometers) • Starting number of bikes in the system • Number of bikes in the system at the final year of project life • Number of trips per bike per day at starting year • Number of trips per bike per day at final year of project life • Mode Shift Details • Speed, Occupancy, Emission Factors 10
TEEMP Models – Bike Sharing System Defaults Mode Shifts towards Bike Sharing Schemes Around the World Source: Various studies 11
TEEMP Models – Bike Sharing System Example – Beijing Bike Share System
TEEMP Models – Bikeways • Allows Sketch Analysis and Detailed Analysis • Sketch Analysis – In case the user does not have any data on expected mode share, shift, trip lengths etc. and still needs to assess the likely impact of bikelanes, experience gained from Latin America case studies of Rio de Janeiro and Bogota are useful. It’s assumed that roughly, 1 km of 2m wide bikeways would attract 2000 trips. These trips are then factored based on design and site considerations as shown in the sketch analysis • Detailed Analysis – • Uses before and after trip mode shares. • Includes construction materials – cement, bitumen and steel • Includes speed impact on emissions (based on COPERT and other models) • Allows quantification of PM and NOx emissions
TEEMP Models – Bikeways Discount factors for Sketch Analysis
TEEMP Models – Bikeways Discount factors for Sketch Analysis
TEEMP Models – Bikeways Input Parameters • Detailed Model for different scenarios – BAU – base year, BAU – Horizon year, With Project – Horizon Year • Average mode speeds - Cars, Two Wheelers, Three Wheelers, Taxi, Bus, Jeepney/RTV’s, Walking and Cycling • Vehicle Emission Standards for modes • Fuel Type (Gasoline and Diesel) • Mode share of modes - Cars, Two Wheelers, Three Wheelers, Taxi, Bus, Jeepney/RTV’s, Walking , Cycling and LRT • Average Trip Length - Cars, Two Wheelers, Three Wheelers, Taxi, Bus, Jeepney/RTV’s, Walking and Cycling • Average Occupancy • Fuel Consumption at 50 km speed (kmpl) • Quantity of Cement, Steel and Bitumen/km • Emission factors for Cement, Steel and Bitumen/Ton (production) • CO2,PM and NOx emission Factors
TEEMP Models – Bikeways Impact of Speed on Emissions - Car copert-3, corinair, green transport, diesel, updated road user cost study and trl
TEEMP Models – Bikeways Example – Marikina Bikeway Project (Manila)
TEEMP Models – Walkability Improvement Projects Source: Times of India
TEEMP Models – Walkability Improvement Projects FUTURE MODE SHARES (NO IMPROVEMENT SCENARIO) EMISSIONS (NO IMPROVEMENT SCENARIO) INPUT DATA EMISSIONS SAVINGS TRANSPORT SYSTEM CHARACTERISTICS EMISSIONS (IMPROVEMENT SCENARIO) FUTURE MODE SHARES (IMPROVEMENT SCENARIO)
TEEMP Models – Walkability Improvement Projects • The savings are calculated in two stages • the no improvement scenario wherein the ‘walking trips’ % trip share in the total trips is assumed to go down through time due to deteriorating facilities coupled with raising motorization . • the improvement scenario i.e. after the project i.e. walking trips % share in the total trips will rise through time. • Input Parameters • Project Lifetime (Number of Years) • Starting Year Total Number of Trips/Day • Annual % Increase in Total Trips/day • Mode Share • Average Trip length • Emission Factor • Mode share deterioration due to no improvement/ annual decrease in walk trip share • Increase in walking trips due to improvement/ before and after walkability ratings/ annual increase in walk trip share
TEEMP Models – Walkability Improvement Projects • Scorecard for assessing Walkability • Streets with protected walkway with width adequate to accomodate pedestrian volume and are kept barrier free (including parked cars & hawkers) with non obstructing furniture (40) • Adequately safe crossing facilities (crossing lights, crosswalk striping, raised crossings, or accessible grade seperated as needed depending on traffic volume) with active traffic calming (35) • Blocks/streets with shade/trees (15) • Block Size (scaling factor) • if the area in which the walkability improvements are being made is dominated by small block sizes (average block face of 200 meters or less) • if the area in which the walkability improvements are being made is dominated by larger block sizes (average block face of over 400 meters) • if the area in which the walkability improvements are being made consists of largely gated or walled superblocks (average block face of 600 meters or more)
TEEMP Models – Walkability Improvement Projects • Scorecard for assessing Walkability • Land Use Heterogenity (scaling factor) • if the area in which the walkability improvements are being made has a fairly dense mix of residential and active retail land uses • if the area in which the walkability improvements are being made has only moderate density and mix of residential and active retail land uses • if the area in which the walkability improvements are being made has low density or low homogenity of land uses • Interpolates the initial trip mode share and walkability score with final walkability score ( capping limit of walking trip mode share @ 50%)
TEEMP Models – Walkability Improvement Projects Example – Walkability Improvement Project
TEEMP Models – BRTS Source: CAI-Asia. 2010
TEEMP Models – BRTS Source: CAI-Asia
TEEMP Models – BRTS BRT CONSTRUCTION CONSTRUCTION EMISSIONS TRANSPORT SYSTEM CHARACTERISTICS 1 EMISSIONS SAVED DUE TO MODE SHIFT INPUT DATA TRAFFIC IMPACT OF BRT EMISSIONS SAVED (WITH SCALING FACTORS) BRT CHARACTERISTICS SCALING FACTORS 2 OPERATION EMISSIONS BRT OPERATIONS NET EMISSIONS SAVINGS 1 Speed, technology, fuel type, occupancy, fuel efficiency, vehicle emission factors, trip length, mode shares 2 Scaling factor for land use, demand, speed scaling factor, dissemination
TEEMP Models – BRTS Savings due to improved public transport vehicles, model shift from private automobiles, compact development and operational efficiency improvement • Input Data Requirements • Construction Materials – Steel, Cement and Bitumen • Ridership ( Base, Intermediate and future year) – Ridership Calculator • Trip length of BRT users • Length of BRT line • Average speed of modes • Fuel Economy Annual Yearly Improvement (%) • Fuel Economy (KMPL measured @ 50kmph speed) at Base Year • upstream effect of emissions due to fuel production • Gasoline and Diesel emission factors • Mode share of BRT users in BAU case • Emission factors for PM and NOx. • Average Trip Length of modes in BAU • Average Occupancy of Modes in BAU • City Trip characteristics • Fuel Split % of Vehicles • Technology split % • Motorized modeshift factor • Public Transport and Intermediate Public Transport Mode Shift Factor • Landuse factor • BRTS – Component information - Running ways, stations, vehicles, service patterns, ITS application, BRT branding
TEEMP Models – BRTS Scorecard for the BRTS to differentiate between Good and Bad BRTS 1a. Infrastructure: Cross Section/ROW (pick one) Dedicated right of way in curb lane, no barrier (1) Physically segregated right of way, curb lane (2) Dedicated right of way in central verge (median-aligned) no barrier (5) Dedicated right of way in central verge, w/ barrier (7) 1b. Infrastructure: station/junction relation Station separated from junction by min of 70 meters(3) 1c. Road works at station (pick one) Passing lanes at station, pphpd <6000 (5) Passing lanes at station stops, pphpd >6000 (8) Not Applicable
TEEMP Models – BRTS Scorecard for the BRTS to differentiate between Good and Bad BRTS 2a. Station design (select all relevant) 2b. Stations: Bus docking interface Multiple docking bays w/ space to pass, pphpd <6000 (3) Multiple docking bays w/ space to pass, pphpd > 6000 (6) 3 or more doors (4) Boarding platform level with bus floor (8)
TEEMP Models – BRTS Scorecard for the BRTS to differentiate between Good and Bad BRTS 2c. Station Accessibility
TEEMP Models – BRTS 3. Operations
TEEMP Models – BRTS Scorecard for the BRTS to differentiate between Good and Bad BRTS 4. Passenger information and branding
TEEMP Models – BRTS • Factors used • Motorized Mode Shift Factor - % of MRT Users who would use motorized transport in absence of MRT • Land Use Impact Factor - Its Vehicle Mile displaced per MRT passenger Mile. Research by APTA suggests a value of 1.9 as a placeholder.
TEEMP Models – BRTS Example
TEEMP Models – Metro/LRT Source: LA Times
CO2 EMISSIONS CONSTRUCTION MRT OPERATIONS ELECTRICITY CONSUMED INPUT DATA USING MRT KILOMETERS TRAVELLED CITY ANALYSIS BOTTOM UP – USING EMISSION FACTORS AND RIDERSHIP TRAFFIC IMPACT OF MRT USERS CO2 EMISSIONS 80% REDUCTION IN MOTORIZED VKT 100% REDUCTION IN MOTORIZED VKT 20% REDUCTION IN MOTORIZED VKT 50% REDUCTION IN MOTORIZED VKT CO2 EMISSIONS SHIFT FROM IPT AND PT USER DEFINED MODE SHIFT FACTOR LAND USE FACTORS CO2 EMISSIONS TEEMP Models – Metro/LRT
TEEMP Models – Metro/LRT The MRT emissions model captures the impact of Mass Rapid System on CO2 emissions by quantifying the construction, operation and traffic impacts of projected MRT users • Input Data Requirements • Construction Materials – Steel, Cement and Bitumen • Emission factor – g/pkm • Electricity grid mix for Calculation Emissions from MRT • Electricity Consumption (Mwh) by MRT • Ridership ( Base, Intermediate and future year) • Trip length of MRT users • Length of MRT line • Average stream speed • Fuel Economy Annual Yearly Improvement (%) • Fuel Economy (KMPL measured @ 50kmph speed) at Base Year • upstream effect of emissions due to fuel production • Gasoline and Diesel emission factors • Mode share of MRT users in BAU case • Average Trip Length of modes in BAU • Average Occupancy of Modes in BAU • City Trip characteristics • Fuel Split % of Vehicles • Motorized modeshift factor • Landuse factor\
TEEMP Models – Metro/LRT Emissions from Construction are neglected in the CDM methodology NM0266. “These have not been included as other methodologies in the energy or industrial sector do not include them also, based on the argument that material demand resulting from the project is non-significant in relation to national production. A clear case is e.g. ACM 0002 where dams can be built for hydropower projects without requiring the inclusion of construction related emissions (cement basically) although these might be very large quantities. ACM 0002 chapter leakage: “The main emissions potentially giving rise to leakage in the context of electric sector projects are emissions arising due to activities such as power plant construction, fuel handling (extraction, processing, and transport), and land inundation (for hydroelectric projects – see applicability conditions above). Project participants do not need to consider these emission sources as leakage in applying this methodology.” In the context of consistency of methodologies and equal approach to projects independent of the sector in which they are realized the construction related emissions for MRTs are not included in this methodology.” http://cdm.unfccc.int/UserManagement/FileStorage/YT9N5JM6J96BINCTBA625V8RCOA4EP
TEEMP Models – Metro/LRT EMISSION FACTORS
TEEMP Models – Metro/LRT Example – Bangalore Metro
TEEMP Models – Roads (Expressway, Rural and Urban) Source: CAI Asia
TEEMP Models – Roads (Expressway, Rural and Urban) INPUT TRAFFIC DATA AND ROAD CHARECTERISTICS CAPACITY ANALYSIS CONSTRUCTION DATA SPEED CO2 EMISSIONS ROUGHNESS FACTOR CO2 EMISSIONS CO2 EMISSIONS