Download
1 / 10
100 likes | 190 Vues
Learn the Rules of Good Graphing (ROGG) for effective data visualization. Always title, label axes with units, circle points with uncertainty, and connect with appropriate lines. Maximize the use of graph paper and create keys when needed. Embrace line graphs but be prepared for histograms too. Master the art of graphing with these essential tips!

E N D
How to Make a Graph Aka….. Rules of Good Graphing ROGG
1. Always title and underline the title of the graph. • Ex. Figure 1: Average Bubble Dome Size
Label both the horizontal and vertical axes. The horizontal axis / X axis contains the independent variable.The vertical / Y axis contains the dependent variable.Be sure to include units!!!!! • Ex. Length of Stem (meters)
3. Use the WHOLE sheet of graph paper when making a graph. Be sure to set up your units appropriately.
4. Be sure to circle your point with a small circle. This is called the circle of uncertainty and accounts for scientific error.
5. Connect circled points with a curve or a straight line (whichever is appropriate). DO NOT go thru the point!
6. Make a key if necessary using different colored lines or dashed lines.
Write your name in the upper right hand corner of the page.Ex. J. Liggett
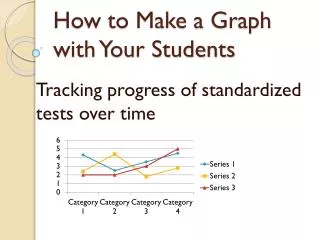
HISTOGRAM – • this is a bar graph • BUT…… always assume that you need to make a line graph unless a bar graph / histogram is specified!