Comparative Analysis of PC3pip Tumor Uptake of PSMA-1-IR800 and PSMA-1-Cy5.5 via FMT
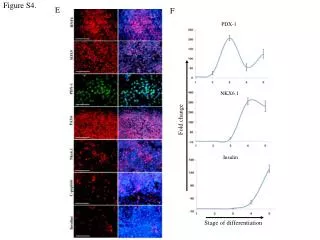
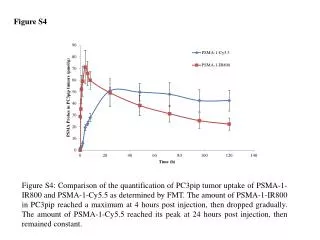
This figure illustrates the quantification of tumor uptake for PSMA-1-IR800 and PSMA-1-Cy5.5 in PC3pip cells, as determined by fluorescence molecular tomography (FMT). The PSMA-1-IR800 compound peaked at 4 hours post-injection, showing a gradual decline thereafter. In contrast, PSMA-1-Cy5.5 reached its maximum uptake at 24 hours post-injection and maintained a stable level. This comparison highlights the distinct kinetic profiles of these two imaging agents in tumor-targeted applications.

Comparative Analysis of PC3pip Tumor Uptake of PSMA-1-IR800 and PSMA-1-Cy5.5 via FMT
E N D
Presentation Transcript
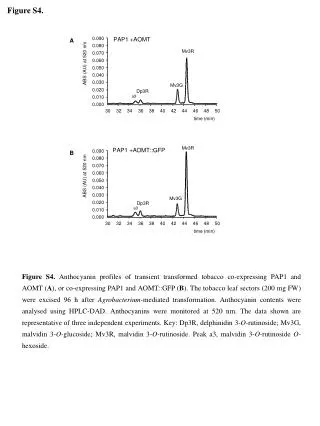
Figure S4 Figure S4: Comparison of the quantification of PC3pip tumor uptake of PSMA-1-IR800 and PSMA-1-Cy5.5 as determined by FMT. The amount of PSMA-1-IR800 in PC3pip reached a maximum at 4 hours post injection, then dropped gradually. The amount of PSMA-1-Cy5.5 reached its peak at 24 hours post injection, then remained constant.