Download
1 / 24
240 likes | 384 Vues
From Fault Recording to Disturbance Recording. Sakis Meliopoulos Georgia Power Distinguished Professor School of Electrical and Computer Engineering Georgia Institute of Technology Atlanta, Georgia 30332 . Outline. Why FR DR Requirements/data processing

E N D
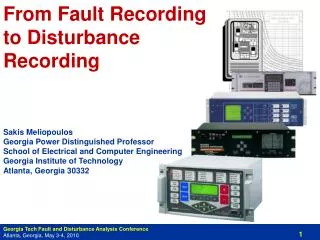
From Fault Recording to Disturbance Recording Sakis Meliopoulos Georgia Power Distinguished Professor School of Electrical and Computer Engineering Georgia Institute of Technology Atlanta, Georgia 30332
Outline • Why FR DR • Requirements/data processing • Historian for Disturbance Play Back • Conclusions
Why FR DR • Following the 2003 blackout, numerous engineers worked for months to align and synthesize fault recorded data for the purpose of re-creating the disturbance and the evolution of the blackout • There must be a BETTER WAY
FR DR: How • For Disturbance Recording and playback: • Recording system requirements • Storage schemes (what to store – data processing - model) • Playback and system synthesizing
What to Store The SuperCalibrator Concept as a Data Compressor Fact: A plethora of data is available at the substation level • The SuperCalibrator is conceptually very simple: • Utilizes all available data (Relays, DFRs, PMUs, Meters, etc.). • Utilizes a detailed substation model (three-phase, breaker-oriented model, instrumentation channel inclusive and data acquisition model inclusive). • At least one GPS synchronized device (PMU, Relay with PMU, etc.) Results on UTC time enabling a truly decentralized State Estimator. • Extracts the Real Time Model of the System form all available measurements mentioned above. Recently this approach has been extended to dynamic state estimation with build in fault locating: PMU data of phasors, frequency and rate of frequency change are used to provide the dynamic state of the system in a reliable and robust way
Distributed Dynamic State Estimation Implementation System is Represented with a Set of Differential Equations (DE) The Dynamic State Estimator Fits the Streaming Data to the Dynamic Model (DE) of the System
SuperCalibrator Measurement Set Conversion of Non-Synchronized Measurements into Phasors αis a synchronizing unknown variable cos(α) and sin(α) are unknown variables in the state estimation algorithm. There is one αvariable for each non-synchronized relay
Dynamic State Estimation – Block diagram Dynamic State Estimation Problem is Converted to Static by Integration Least Squares Solution Bad Data Detection Bad Data Identification and Removal
Dynamic State Estimation: Numerical Experiments Test System: 3 generating substations and an infinite bus connected through overhead transmission lines Substation 1: Substation of interest where DSE is performed Simulated 3 phase fault near Substation 3 DSE uses PMU and other relay measurements in the first substation DSE algorithm estimates local and neighboring substation states
Numerical Experiments:Post Fault DSE Performance Simulated and Estimated Voltage Magnitude at Substation 3 (neighboring substation) for post fault condition Simulated and Estimated Voltage Phase angle at Substation 3 (neighboring substation) for post fault condition
Distributed Dynamic State Estimation Implementation 1 Physical Arrangement Data Flow Data/Measurements from all PMUs, Relays, IEDs, Meters, FDRs, etc are collected via a Local Area Network in a data concentrator. The data is used in a dynamic state estimator which provides the validated and high fidelity dynamic model of the system. Bad data detection and rejection is achieved because of high level of redundant measurements at this level.
The USVI WAPA System Provides an Excellent Testbed for the Distributed Dynamic State Estimator The USVI WAPA system is a small 270 MW, Five Substations, 35 kV/13 kV System. 17 relay/PMUs. Faults create large swings of the generators as manifested by the frequency oscillations in the Feb 20, 2008 event. In addition events are more frequent in the USVI system than mainland systems.
Distributed Dynamic State Estimation During a Fault The Dynamic State Estimator Operates at 10 times per second What happens when a fault occurs? Introduce the Fault Location (F) as another State to be Estimated
Historian for Disturbance Play-Back Substation Storage Scheme Full Model + Model Changes + Data • System FULL MODEL stored once a day in WinIGS format – time of day can be arbitrarily selected, for example at 2 am. (example storage follows) • Report system changes by exception – UTC time (example storage follows) • Storage of state data: at each occurrence of the state estimator, the estimated states are stored in COMTRADE-like format. (example storage follows)
Substation Storage Scheme FULL MODEL + Model Changes + Data System FULL MODEL stored once a day in WinIGS format. Time of day can be arbitrarily selected, for example at 2 am. Example storage: MODEL 3 DEV_TITLE Long Bay Substation NUMERIC_ID 77 NET_LAYER 3 GEO_COORDINATES 18.339260000 -64.920927000 COORDINATES -137 2 -144 -1 -137 4 -138 -1 -145 0 -145 7 -145 4 -141 6 COORDINATES -141 -2 -142 2 INTERFACES FDR-9B 3-0A0B2 FDR-8B FDR10B FDR-YH1 3-0B0D 3-0A0B1 FDR-7B INTERFACES FDR-YH2 PARAMETERS LONGBAY VIWAPA VIWAPA END_MODEL MODEL 123 DEV_TITLE Feeder #11, Long Bay to East End Substation - Section 1 NUMERIC_ID 246 COORDINATES -145 7 -145 10 -141 13 -132 13 -126 10 -120 6 -114 4 -109 3 COORDINATES -107 1 -105 -2 CIRCUITS 1 INTERFACES 3-0B0D_N 3-0B0D_A 3-0B0D_N 3-0B0D_B 3-0B0D_N 3-0B0D_C 3-0B0D_N UG350_N INTERFACES UG350_A UG350_N UG350_B UG350_N UG350_C UG350_N PARAMETERS 5 7 14.40 3868.0 0.0 0.0 0.0 CABLE PARAMETERS VI34KV750KCM-CU-TS -0.10802 -3.09671 CKT1 CABLE VI34KV750KCM-CU-TS -0.00119 -2.92351 PARAMETERS CKT1 CABLE VI34KV750KCM-CU-TS 0.11108 -3.09234 CKT1 CABLE CONDUIT8 PARAMETERS -0.00656 -2.93099 CKT1 COPPER 4/0 0.00667 -3.18108 CKT1 PARAMETERS 1 CKT1 5499.0 25.0000 34.5000 END_MODEL MODEL 123 ……… ……… Substation Model Transmission Line Model
Substation Storage Scheme Full Model + MODEL CHANGES + Data Report system changes by exception – UTC time MODEL_CHANGE TIME 1267771497 450123 TYPE XFMR_TAP DEVICE_ID 1265 VALUE R12 END_MODEL_CHANGE MODEL_CHANGE TIME 1267771791 609355 TYPE BREAKER_OPERATION DEVICE_ID 3409 VALUE CLOSE END_MODEL_CHANGE . . . . . . . . . SOC + Fractional Second March 05, 01:44:57.450123 File Format – Each line begins with a keyword optionally followed by one or more arguments.
Substation Storage Scheme Full Model + MODEL CHANGES + Data Storage of state data: at each occurrence of the state estimator, the estimated states are stored in COMTRADE-like format. The following File Types Are Used: Configuration Files: Description of State Names Types and Locations State Data Files: State Values plus Model Change Information Triggered Event Files: Waveform data recorded for each triggering event in COMTRADE format.
Substation Storage Scheme Full Model + MODEL CHANGES + Data Storage of state data: at each occurrence of the state estimator, the estimated states are stored in COMTRADE-like format. Configuration File – One for Each Day File Naming Standard: CompanyName_SubstationName_SOC.scf File Content: <Title or Brief Description> <SOC> <uSec> <Number of States> <State Name>, <State Type>, <Bus Name>, <Phase>, <Power Device ID> <State Name>, <State Type>, <Bus Name>, <Phase>, <Power Device ID> . . . . . . • Where: • SOC: is the Second of Century Time Code defined as the number of seconds elapsed since midnight of January 1, 1970 (in UTC time) • uSec is a fractional second value in microseconds. • Above structure repeated each time the set of states changes
Substation Storage Scheme Full Model + MODEL CHANGES + Data Storage of state data: at each occurrence of the state estimator, the estimated states are stored in COMTRADE-like format. State Data File – One for Each Day File Naming Standard: CompanyName_SubstationName_SOC.sdf File Content: STATE_VECTOR <SOC> <uSec> <State Value> <State Value> <State Value>. . . STATE_VECTOR <SOC> <uSec> <State Value> <State Value> <State Value>. . . . . . . . . STATE_VECTOR <SOC> <uSec> <State Value> <State Value> <State Value>. . . MODEL_CHANGE TIME 1267771791 609355 TYPE BREAKER_OPERATION DEVICE_ID 3409 VALUE CLOSE END_MODEL_CHANGE STATE_VECTOR <SOC> <uSec> <State Value> <State Value> <State Value>. . . STATE_VECTOR <SOC> <uSec> <State Value> <State Value> <State Value>. . . . . .
Substation Storage Scheme Full Model + MODEL CHANGES + Data Storage of state data: at each occurrence of the state estimator, the estimated states are stored in COMTRADE-like format. Triggered Event Files – One for Each Event File Naming Standard: CompanyName_SubstationName_SOC.cfg CompanyName_SubstationName_SOC.dat File Content: Standard COMTRADE Waveform File Format
Re-Construction of System State • System Operation “Play Back” over a user specified time interval (t1 to t2) • Reconstructed state is presented via graphical visualization Techniques, ( 3-D rendering, animation etc) with multiple user options.
Wide Area Monitoring and Disturbance Play-Back The SuperCalibrator at each substation stores the streaming data with (a) time tags, (b) network status, and (c) substation real time model at the time. This data can be “played back” for any user specified past time interval. Various visualizations allow the user to observe specific performance parameters of the system. Examples are: (a) voltage profile evolution, (b) transient swings of the system, (c) electric current flow, etc.
Conclusions • The Dynamic State Estimator fits PMU data to the Dynamic Model of the System: Enables a powerful method to study system dynamics and predict performance. • Fault Location Estimation has been integrated into the Dynamic State Estimator. • Substation storage scheme (historian) that enables automated Disturbance Play Back. The implemented historian of (full model) + (model changes) + (data) has been presented. Comments and suggestions are welcome. • Need for standards for disturbance+modelstorage and playback that include coincident system models.