Download
1 / 12
120 likes | 274 Vues
This document provides an in-depth exploration of advancements in quantitative methods for supply chain risk management. Covering four key levels of risk assessment, it distinguishes between anecdotal opinions and informed, data-driven perspectives. The focus includes objective data tracking of critical supply chain metrics, risk quantification, and scenario planning, enhancing the understanding of supply/demand dynamics with confidence levels. The analysis encompasses a range of factors, including inventory, capacity, demand profiles, and the intricacies of semiconductor supply chains.

E N D
Supply Chain Risk Assessments Advances in quantitative methods
Four levels of supply chain risk management • Anecdotal, un-calibrated opinion • Read the papers, ask around, develop an opinion • Objective data informed opinion • Independent tracking of critical supply chain metrics, develop a more informed opinion or an informal model • Objective data, objective projections • Independent tracking of critical supply chain metrics that enable a projection of supply/demand balance with confidence levels • Quantification of risk • Risk quantified scenario planning • Multiple scenariosanalyzed Supply Chain information
Critical supply chain metrics • Multi-sourced or substitutable products • Inventory • Capacity • Demand profiles and elasticity • Price – as the reflection of where supply = demand • Proprietary sole sourced products • Process Cpk (manufacturing and supply chain processes) • Available supplier capacities and inventories • Other demand for the capacity and end product demand for hardware that consume products that use the capacity
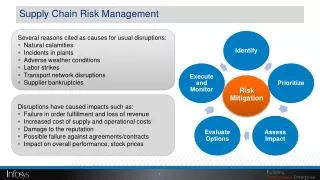
$41,769 $47,572 $47,572 EMS $16,168 $5,803 OEMs Top 10 $75,253 $42,432 $42,774 $16,311 $27,235 $342 Semiconductor Suppliers $241,055 OEMs 11 To 100 $89,338 $55,802 $50,222 $5,580 Distributor $36,678 $6,301 $4,169 $24,263 OEMs > 100 $76,464 $69,323 $45,060 All Semiconductor Flow Values are at Supplier Point-of-Purchase and Do Not Include Intermediate Mark-Ups $2,972 $690 ODM $25,584 $24,894 $25,584 Semiconductor supply chain – 2005 • The semiconductor supply chain is highly inter-connected
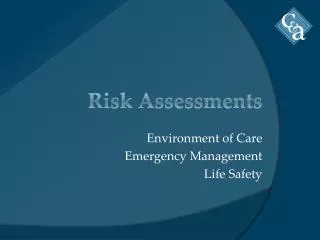
Total Inventory Levels Relative to Targets Retail Networking Systems Automotive EMS Wireless OEMs WSP Distribution Computer ODM Storage Semiconductor *COGS, except Semi Companies and Semi Foundry, which are calculated on a Cost of Revenue basis
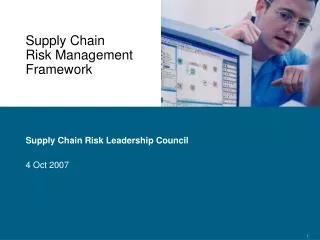
210 100 180 90 150 80 120 Millions Sq.In./ Month Percentage Utilization 90 70 60 60 30 0 50 2000 2001 2008 2009 2010 Q303 Q403 Q104 Q204 Q304 Q404 Q105 Q205 Q305 Q405 Q106 Q206 Q306 Q406 Q107 Q207 Q102 Q202 Q302 Q402 Q103 Q203 Q307 Q407 Capacity million Sq. In/ mo. Memory Utilization Memory Semiconductor Factory Capacity and Utilization
Component Health Watch Price and lead time trending for 12 different commodity groups
CPT (Component Price Tracking) Price is adjusting factor to equalize supply and demand • So tracking and projecting REAL prices is the single most important factor in assessing supply chain risk Rolling Four-Quarter Forecast (Contract only) Client can compare their survey points to CPT graphs Graph a Single Price Type or Region or Combine the Graph Views
Predicting next month’s DRAM market • iSuppli has now constructed an “iSuppli Index” that uses our weekly pricing, inventory, mix, and capacity utilization data sets to accurately predict market dynamics month ahead (2 months ahead of release of WSTS) with very high confidence • A key step to giving quantitative market and supply chain risk measurements Coefficient t-statisticp-value iSuppli Index 0.589214 7.86084 0.000000