Download
1 / 24
240 likes | 422 Vues
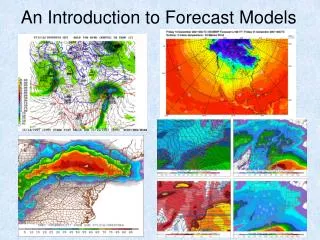
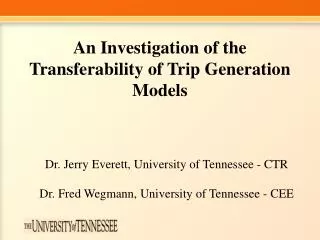
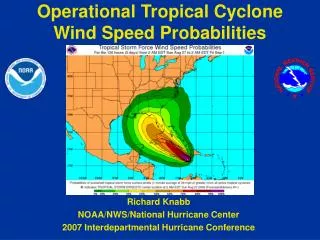
An Investigation of Cool Season Extratropical Cyclone Forecast Errors Within Operational Models. Brian A. Colle 1 and Michael Charles 1,2 1 School of Marine and Atmospheric Sciences Stony Brook University – SUNY 2 National Centers for Environmental Prediction. Motivation.

E N D
An Investigation of Cool Season Extratropical Cyclone Forecast Errors Within Operational Models • Brian A. Colle1 and Michael Charles1,2 • 1 School of Marine and Atmospheric Sciences • Stony Brook University – SUNY • 2 National Centers for Environmental Prediction
Motivation • Complete a long-term (5-year) cyclone verification of the operational NCEP GFS and NAM models (several years since the last objective evaluation). • What synoptic flow patterns are associated with particular cyclone errors in operational models? • What is the impact of using the NCEP Short-Range Ensemble Forecast (SREF) system for cyclone prediction?
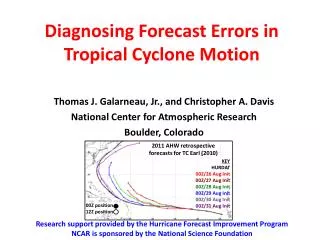
Automated Cyclone Verification using NCEP Tracking algorithm (Marchok 2002) http://www.emc.ncep.noaa.gov/gmb/tpm/emchurr/tcgen/ fcst - 960 mb obs - 984 mb obs - 955 mb fcst - 982 mb fcst - 982 mb obs - 982 mb
Data • Cyclone Events (Oct-Mar 2002-2007) • GFS (0-120 hr every 6 h) at 80 km grid spacing • Eta/NAM (0-60 h every 6-h) at 40-80 km grid spacing • Same cyclones and times were used to compare models. Interpolate to common 80-km grid • SREF (Oct-Mar 2004-2007) • 15 members (5 Eta-KF, 5 Eta-BM, 5 RSM) • ~40 km grid spacing (212 grid) • Available at 09 & 21 UTC ( 63 h forecast) • Included 6 SREF WRF members for 2006-2007
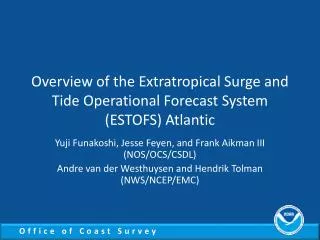
NAM-GFS analysis cyclone central pressures for 2002-2007 cool seasons Mean Analysis SLP Error as compared to surface observations for cyclones within 500 km of station Mean Abs Error Mean Error Central and Eastern N Amer W. Atlantic W. Atlantic Western N Amer Western N Amer Central and Eastern N Amer Pacific Pacific
Cyclone Central Pressure Mean Absolute Errors in mb (18-36 h) GFS NAM
Cyclone SLP Abs Error versus Fhour By Region 3 2 5 1 CP CA 4 6 NAM GFS E. Pacific W. Atlantic E. Pacific W. N.A. Cent N.A.
Cyclone Central Pressure Mean Error in mb (48-60 hrs) GFS NAM
Western Atlantic Cyclone Position Errors (42-60 h) GFS NAM All Cyclones Deep (1.5 stnd dev) Cyclones
* GFS extra-tropical 1989-90 (Mullen and Smith 1993) * X 1995-1998 GFS Atlantic hurricane track error X X X X X X 2002-2006 GFS Atlantic hurricane track error X GFS SLP MAE 12 UTC versus 18 UTC Runs 18 UTC 12 UTC E. Pacific W. Atlantic Cent N.A. GFS cyclone displacement error (km) for 12 UTC versus 18 UTC Runs
Cyclone SLP Abs Error in mb (48 h) NAM GFS E. Pacific E. Pacific E. US. and W Atl E. US. and W Atl Central U.S. Central U.S.
Cyclone Displacement Error in km (48-h) NAM GFS E. Pacific E. Pacific W. Atlantic W. Atlantic
(970 mb) (990 mb) (992 mb) (975 mb) (973 mb) GFS Median Range Mean Absolute SLP Error DEEP CYCLONES (> 1.5 stnd dev) ALL CYCLONES W. Atlantic W. Atlantic E. N.A. E. N.A. W. N.A. E. Pacific W. N.A. E. Pacific Cent N.A. Cent N.A.
(970 mb) (990 mb) (992 mb) (975 mb) (973 mb) GFS Median Range Mean SLP Error (Deep storms) W. Atlantic E. Pacific E. N.A. Cent N.A. W. N.A.
Hour 72 Hour 96 Random Error Days Large Error E. Pac (>1.5 std dev) Hour 30
GFS Large Error Cyclone Events for 48-h (Regions 5,6) GFS negative SLP error (1.5 std dev > mean error, or < -5.1 mb) GFS positive SLP error (1.5 std dev > mean error, or > 4.5 mb) Model pressure tendency error (mb/6h)
SREF and GFS/NAM Displacement Error (W. Atlantic) NAM SREF GFS NAM SREF and GFS/NAM Central Pressures Mean Absolute Error (W. Atl) SREF GFS
51-h SREF (valid 2006011500) EKF EBM RSM X NAM X GFS X OBS -10 to 0 mb 0 to 10 mb 10 to 20 mb
Rank Histogram of cyclone central pressure and best member likelihood percentage (W. Atlantic) Hours 33-45 RSM Eta-BM Eta-KF
Conclusions • GFS analysis for cyclones is significantly better than the NAM or NARR, especially over the oceanic regions. The NAM and NARR cyclones are too weak on average. • GFS cyclone forecasts have more skill than the NAM in all regions. NAM cyclones are too weak over the E. Pacific on average. • By hour 84, W. Atlantic errors become comparable to the E. Pacific and the errors become greater than E. Pacific for deeper cyclones. • The 09/21z SREF has larger cyclone MAEs than the deterministic GFS and slightly less than NAM. The SREF pressures tends to be overdispersed in many locations. • Some model cyclone biases for the eastern U.S. may favor specific storm tracks. • Large cyclone errors over the E. Pacific can impact the western Atlantic 2-3 days later.
SLP field from grib file Locate grid point with lowest SLP Try to find 2mb closed isobar Mask out cyclone and repeat 2 1 3 4 Cyclone Identification (NCEP Approach) Same used at NCEP - http://www.emc.ncep.noaa.gov/gmb/tpm/emchurr/tcgen/