Infrared Studies of Type Ia Supernovae: Analyzing Light Curves and Hubble Constant
This study presents an atlas of near-infrared and optical light curves of Type Ia supernovae (SNe Ia) derived from both published literature and unpublished JHK data from the CTIO and LCO observatories. The goal was to explore the standardizability of SNe Ia as cosmic distance indicators in the near-infrared. Preliminary findings reveal complex light curve behavior, particularly in the J-band, and suggest consistent H-band absolute magnitudes. Notably, a Hubble constant of 71.5 ± 2.5 km/s/Mpc was obtained from the H-band Hubble diagram.

Infrared Studies of Type Ia Supernovae: Analyzing Light Curves and Hubble Constant
E N D
Presentation Transcript
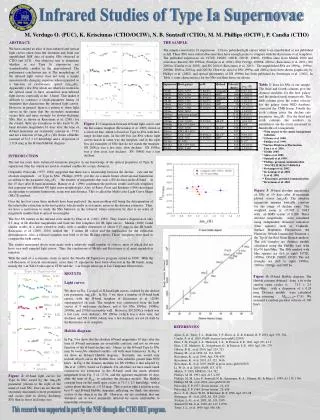
Infrared Studies of Type Ia Supernovae M. Verdugo O. (PUC), K. Krisciunas (CTIO/OCIW), N. B. Suntzeff (CTIO), M. M. Phillips (OCIW), P. Candia (CTIO) ABSTRACT: We have created an atlas of near-infrared and optical light curves taken from the literature and from our unpublished JHK data of nearby SNe observed at CTIO and LCO. Our objective was to determine whether or not Type Ia supernovae are standardizable candles in the near-infrared. The preliminary conclusions are: a) The morphology of the infrared light curves does not form a simple monotonically changing sequence when organized as a function of evolutionary speed (Dm15(B)). Apparently a few SNe which are otherwise normal in the optical seem to have anomalous near-infrared light curves, especially in the J-band. This makes it difficult to construct a single-parameter family of templates that characterize the infrared light curves. However, in general there is a pattern to these light curves in the sense that the secondary maximum occurs later and more strongly for slower-declining SNe. But, as shown in Krisciunas et al. (2001) for the I-band, there are exceptions to this trend. b) H-band absolute magnitudes 10 days after the time of B-band maximum are essentially constant at -17.91 and not a function of Dm15(B) c) We obtain a Hubble constant of 71.5 2.5 km/s/Mpc and a dispersion of 0.24 mag in the H-band Hubble diagram. THE SAMPLE The sample consisted in 18 supernovae. 12 have published light curves while 6 are unpublished or not published in full. These SNe were selected because they have enough points to compare with the Krisciunas et al. templates. The published supernovae are 1972E, 1980N, 1981B, 1981D, 1986G, 1998bu (data from Meikle 2000 and references therein), SN 1999aw (Strolger et al. 2002), SNe 1999gp, 2000bk, 2000ce (Krisciunas et al. 2001), SN 2000cx (Candia et al. 2003), and SN 2001el (Krisciunas et al. 2003). The unpublished SNe are 1999ac, 1999ee, 2000bh, 2000ca, 2001ay, and 2001ba. However, data for SNe 1999ac and 2001ay have been shown graphically by Phillips et al. (2002), and optical photometry of SN 1999ee has been published by Stritzinger et al. (2002). In Table 1 some characteristics for the SNe and their hosts are shown. Table 1: Data for SNe of our sample. The third and fourth columns give the distance modulus for the host galaxy and the method used, respectively. The fifth column gives the radial velocity for the galaxy from NED database, corrected the CMB frame. Finally the sixth column gives the decline rate parameter Dm15(B). For the third and sixth columns the numbers in parentheses are the errors measured in hundredths of a magnitude. Figure 1:Comparison between H-band light curves and the Krisciunas template (Krisciunas et al. 2000) shown as a solid red line, which is based on Type Ia SNe with mid-range decline rates. In the left box are SNe whose light curves match in some way the template, and in the right box are examples of SNe that do not match the template. SN 2000cx was a fast riser, slow decliner. SN 1999ac was a slow riser, fast decliner. SN 1986G was a fast decliner. a With respect to the cosmic background radiation. b Gibson et al. 2000. c Phillips et al. 1999. d Surface Brightness Fluctuation, Tonry et al. 2001. e Meikle 2000. f Ajhar et al. 2001. g Suntzeff et al. 1999. h Phillips, personal communication. i WOOTS J110136.37-060631.6 j Stritzinger et al. 2002 k Krisciunas et al. 2001 l Li et al. 2001 m Krisciunas, personal communication. n Krisciunas et al. 2003 INTRODUCTION The last ten years have witnessed enormous progress in our knowledge of the optical properties of Type Ia supernovae (Sne Ia), which are used as standard candles for cosmic distances. Originally, Pskovskii (1977, 1984) suggested that there was a relationship between the decline rate and the absolute magnitude of Type Ia SNe. Phillips (1993) put this on a much firmer observational foundation according to the parameter Dm15(B), the number of magnitudes that such a SN declines in the B-band in the 15 days after B-band maximum. Hamuy et al. (1996) confirmed the previous results and built templates that represent two different SN light curve morphologies. Also, in Riess, Press and Kirshner (1996) developed an algorithm to estimate luminosity, extinction and distance. This is called the Multi-color Light Curve Shape (MLCS) method. Over the last few years these methods have been perfected, the main problem still being the determination of the interstellar extinction in the host galaxy, which results in systematic errors in the distance estimates. Thus, we have a motivation to study the SNe behavior in the infrared, where extinction by dust is an order of magnitude smaller than at optical wavelengths. The first SN studies in the infrared were made by Elias et al. (1981, 1985). They found a dispersion of only 0.2 mag in IR absolute magnitudes and built the first templates for IR light curves. Meikle (2000) found similar results in a more extensive study, with a smaller dispersion of about 0.15 mag in the IR bands. Krisciunas et al. (2000, 2001) studied the V minus IR colors and the implication for the extinction determination. Also, a fiducial template was built to fit the IR-light curves. These templates were used to compare the light curves. The studies mentioned above were made with a relatively small number of objects, most of which did not have very well sampled light curves. Thus, the conclusions of Meikle and Krisciunas et al. must regarded as tentative. With the need of a systematic study in mind, the Nearby IR Supernova program started in 1999. With the collaboration of several astronomers, more than 15 supernovae have been observed in the IR bands, using mainly the 1-m YALO telescope at CTIO and the 1-m Swope telescope at Las Campanas Observatory. Figure 3: H-band absolute magnitudes of SNe at 10 days after B-maximum plotted versus Dm15(B). The absolute magnitude remains basically constant for the range of decline rates. The weighted mean is -17.905 0.045 with an RMS scatter of 0.206. These absolute magnitudes were calculated using independent distances indicators (blue squares) such as Cepheids, Surface Brightness Fluctuations, the Planetary Nebula Luminosity Function o the Tip of the Red Giant Branch method. The red triangles are distance moduli calculated using the Hubble Law with H0=74 km/s/Mpc. The SNe marked with blue squares are (left to right) 1972E, 1998bu, 1981B, 1980N, 1981D. The red triangles are (left to right) 1999ee, 2000ce, 1999gp, and 2001ba.. RESULTS Light curves We show in Fig. 2 a stack of H-band light curves, ordered by the decline rate parameter Dm15(B). In Fig. 3 we show a number of H-band light curves, with the H-band template of Krisciunas et al. (2000) superimposed on each. The template was constructed from the light curves of 8 mid-range decliners, and it fits SNe 1999ee, 1998bu, 2000bh, and 2001el reasonably well. However, SN 2000cx (which was a fast riser, slow decliner), SN 1999ac (which was a slow riser, fast decliner) and SN 1986G (which was a fast decliner) are not fit well by the Krisciunas et al. template. Hubble diagram In Fig. 3 we show that the absolute H-band magnitudes 10 days after the time of B-band maximum are essentially constant, and not an obvious function of the B-band decline rate. Hence, in the H-band Type Ia SNe may be bona fide standard candles - all with same luminosity. In Fig. 4 we show an H-band Hubble diagram. Normally, one would only include objects out in the Hubble flow, with redshifts greater than 3000 km/s. In Fig. 4 the distance modulus for SN 1998bu is that adopted by Jha et al. (1999), based on Cepheids. For all others we have made small corrections for extinction in the H-band, used the mean absolute magnitude from Fig. 3 of -17.91, and the apparent magnitude 10 days after the time of Bmax to calculate the distance moduli. The Hubble constant base on the small open circles is 71.5 2.5 km/s/Mpc, with a scatter about the line of 0.24 mag. This is not as tight a relation as the best V- and B-band Hubble diagrams, reflecting, we think, the intrinsic scatter of the objects in the IR. However, we are confident that our distances are at worst minimally affected by errors attributable to interstellar extinction. Figure 4:H-band Hubble diagram. The Hubble constant obtained from a fit to the smaller open circles is 71.5 ± 2.5 km/s/Mpc, with a dispersion of ± 0.24 mag. Distance moduli were calculated using assuming MH(t=10 d)=-17.91. We assumed a random peculiar velocity of 300 km/s. REFERENCES Ajhar, A. A., Tonry, J. L., Blakeslee, J. P., Riess, A. G. & Schmidt, B. P. 2001, ApJ, 559, 584. Candia, P., et al. 2003, PASP, in press (astro-ph/0212543) Elias, J. H., Frogel, J. A., Hackwell, J. A., & Persson, S. E. 1981, ApJ, 251, L13 Elias, J. H., Mathews, K., Neugebauer, G., & Persson, S. E. 1985, ApJ, 296, 379 Gibson, B. K., et al. 2000, ApJ, 529, 723 Hamuy, M., et al. 1996, AJ, 112, 2438 Krisciunas, K., et al. 2000, ApJ, 539, 658 Krisciunas, K., et al. 2001, AJ, 122, 1616 Krisciunas, K., et al. 2003, PASP, in press (astro-ph/0210327) Li, W. D., et al. 2001, PASP, 113, 1178 Meikle, P. 2000, MNRAS, 314, 782 Phillips, M. M. 1993, ApJ, 413, L105 Phillips, M. M., Lira, P., Suntzeff, N. B., Schommer, R. A., Hamuy, M., & Maza, J. 1999, AJ, 118, 1766 Phillips, M. M., et al. 2001, astro-ph/0211100 Pskovskii, Y. P. 1977, Soviet Astron., 21, 675 Pskovskii, Y. P. 1984, Soviet Astron., 28, 658 Riess, A. G., Press, W. H., & Kirshner, R. P. 1996, ApJ, 473, 88 Stritzinger, M., et al. 2002, AJ, 124, 2100 Strolger, L.-G., et al. 2002, AJ, 124, 2905 Suntzeff N. M., et al. 1999, AJ, 117, 1175S Tonry, J. L., et al. 1999, ApJ, 546, 681 Figure 2:H-band light curves for Type Ia SNe sorted by the Dm15(B) parameter (shown to the right of the name of each SN). One can see that the secondary maximum is more prominent and occurs later in slowly declining SNe than in faster declining ones. This research was supported in part by the NSF through the CTIO REU program.