Download
1 / 15
150 likes | 263 Vues
G. Huey, S. Kim, R. Stickel, D. Tanner and INTEX Science Team. Measurements of SO 2 and HO 2 NO 2 with a Chemical Ionization Mass Spectrometer During INTEX-A. Outline. SO 2 (brief) Profile Tracing Sources HO 2 NO 2 Properties Steady State Analysis. SO 2 Altitude Profile.

E N D
G. Huey, S. Kim, R. Stickel, D. Tanner and INTEX Science Team Measurements of SO2 and HO2NO2 with a Chemical Ionization Mass Spectrometer During INTEX-A
Outline • SO2 (brief) • Profile • Tracing Sources • HO2NO2 • Properties • Steady State Analysis
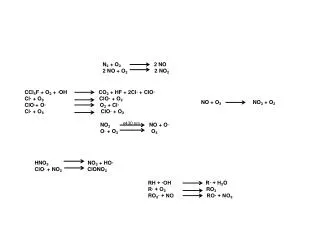
HO2NO2 Formation HO2 + NO2→ HO2NO2k1 Losses 1) Thermal Decomposition – Strong Function of Temperature HO2NO2→ HO2 + NO2k-1 2) Reaction with OH OH + HO2NO2→ H2O + O2 + NO2 k2 3) Photolysis – Both UV and IR (overtone) J HO2NO2+ hν → HOx + NOx
Altitude Profile of HO2NO2 Lifetime for INTEX - A Above 7 km lifetime is dominated by OH and J 6-8 hours Below 7 km lifetime is dominated by thermal decomp. < 3 hours
Measured HO2NO2 –INTEX-A Pernitric peaks at ~9 km with average of 77 pptv
Steady State HO2NO2 SS approximation should be valid at least at lower altitudes.
SS vs. Measured HO2NO2Measured HOx – Filtered Data Correlation driven by higher T, low altitude data
Conclusions • SO2 good marker for coal burning, etc. – need help from transport models to analyze • Pernitric data is consistent with measured HOx and NOx at lower altitudes where thermal decomposition dominates • At all altitudes HO2NO2 data is consistent with measured NO2 and model HOx. • HO2NO2 is a good test of photochemistry above 8 km. Depends on both HO2 and OH. • Other issues to investigate HO2NO2 interaction with cirrus cloud, ratio of HO2NO2 to HNO3 as an indicator of air mass age, HO2NO2 as a marker for ozone production, evaluate magnitude of HO2NO2 as HOx sink, etc.
Cautions • J value is not well constrained – Could it be a factor of 2 higher? • Steady State analysis is certainly imperfect • All model results based on inferred NO – Impacts HO2 to OH ratio