Download
1 / 62
640 likes | 836 Vues
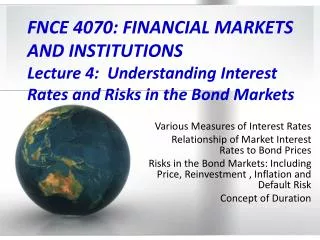
FNCE 4070: FINANCIAL MARKETS AND INSTITUTIONS Lecture 4: Understanding Interest Rates and Risks in the Bond Markets. Various Measures of Interest Rates Relationship of Market Interest Rates to Bond Prices

E N D
FNCE 4070: FINANCIAL MARKETS AND INSTITUTIONS Lecture 4: Understanding Interest Rates and Risks in the Bond Markets Various Measures of Interest Rates Relationship of Market Interest Rates to Bond Prices Risks in the Bond Markets: Including Price, Reinvestment , Inflation and Default Risk Concept of Duration
Grand Cayman Stingray City Turtle Burgers
A Financial Center • A Financial Center is a location: • That has a heavy concentration of financial institutions providing a wide range of financial services (including banking, insurance, cash management, asset management). London, New York, and Tokyo are regarded as the world's three premier financial centers. • An Offshore Financial Center is a location: • That provides financial services to nonresidents on a scale that is disproportionately larger in comparison to the size and the financing of its domestic economy (IMF definition). • Examples include: The Cayman Islands, Gibraltar, Bahrain, and Hong Kong • The Cayman Islands, with a domestic population of 52,000, has 250 banks, with approximately $415 billion in deposits (making it one of the largest financial centers in the world). • Is London an offshore financial center?
Interest Rate Defined • “Dual” Definition: • Borrowing: the cost of borrowing or the price (%) paid for the “rental” of funds. • A financial liability for “deficit” (borrowing) entities. • Saving: the return from investing funds or the price (%) paid to delay consumption. • A financial asset for “surplus” (lending, investing) entities. • Both concepts are expressed as a percentage per year (Percent per annum; “p.a.”). • True regardless of maturity of instrument of the financial liability or financial asset. • Thus, all observed interest rate data is annualized. • See: http://www.federalreserve.gov/releases/h15/update/
Savings and Borrowing Rates: They Move Together, 1977– 2011 • Regression analysis: 1964 – 2010 (monthly data, 564 observations); CD rate as dependent variable. R-squared = 88.55%
Basis Points and Interest Rates • Basis Point: A unit that is equal to 1/100th of 1%, and is used to denote the changes in interest rates or differences in interest rates between various debt instruments. • The relationship between interest rate changes (or differentials) and basis points can be summarized as follows: 1% change (or difference) = 100 basis points. • Example 1: If Bond A’s yield increases from 5% to 6.5%, then Bond A’s yield increased150 basis points. • Example 2: If Bond B’s yield falls from 7.00% to 6.93%, then Bond B’s yield decreased 7 basis points. • Example 2: If Bond C has a yield of 6% and Bond D a yield of 2%, then Bond C is 400 basis points more than Bond D.
Commonly Used Interest Rate Measures • There are four important ways of measuring (and reporting) interest rates on financial instruments. These are: • Coupon yield: The “promised” annual percent return on a coupon instrument. • Current Yield: Bond’s annual coupon payment divided by its current market price. • Yield to Maturity: The interest rate that equates the future payments to be received from a financial instrument (coupons plus maturity value) with its market price today (i.e., to its present value). • Discount Yield and Investment Yield: These are yields on short term (one year or less) debt instruments that have no coupon payments and are selling at a discount of their par values. • These interest rates are the “implied” returns from buying a debt instrument at a price below its par value.
Important Bond Terms • Par Value: The amount that the bond holder will received when the bond matures. • Also called face value and maturity value. • In the U.S. all bonds have a par value of $1,000. • Coupon Payment: This is the (dollar) amount of interest to be paid to the bond holder. Usually expressed on an annual basis (even if the bond pays interest semi-annually). • Market Price: This is the current market price for an outstanding bond. • Premium bond: Market price above its par value • Discount bond: Market price below its par value
Coupon Yield • Coupon yield is the annual interest rate which was promised by the issuer when a bond was first sold. • Coupon information is found in the bond’s indenture (legal contract). • Indenture will state the coupon payment (as a percent of the bond’s par value) and the schedule of payments (semi-annual or annual). • Important: The coupon yield on a bond will not change during the lifespan of the bond. • Go to Bloomberg to view coupon yields: • http://www.bloomberg.com/ • Note: U.S. Treasuries, 12 months and less have no coupons. • Same is true for short term government bonds in other countries.
Par Values: Other Countries • Par values are different in other countries: • UK Government bonds (generally GBP100 par value; called gilts) • Japanese Government bonds (JPY10,000 par value; called JGBs) • German Government bonds (minimum amount EUR100 par value, called bunds) • French Government bonds (minimum amount EUR100; called OATs (Obligations assimilables du Trésor). • Canadian Government bonds (CAD$1,000 par value) • Australian Government bonds (AUD$1,000 par value) • Par value is also called the maturity value (or face value). • Recall, this is what the bond holder receives at maturity date. • Government bonds (including U.S. Treasuries) generally pay interest semi-annually.
Example of a U.S. Treasury Bond • 1.50% U.S. Treasury bond due April 30, 2019 (thus, a bond with 7 year’s to maturity), paying interest semi-annually, with a current market price of 100-12. • The 1.50% is the stated coupon (as a percent of par) • This bond will pay $15.00 per year in interest (.0150 x $1,000); but since it is a semi-annual bond, it will pay $7.50 every six months. • On April 30, 2019, the bond will pay $1,000 (par value) plus 6 months interest ($7.50) or a total of $1,007.50. • The current market price (100-12) is expressed as a percent of par value. • The market price for U.S. Treasuries has two components: • The (1) “handle” (number to the left of the -) and (2) the 32nds (number to the right of the -). We need to convert these two components to a percentage. • Start with the 32nds; 12/32 = 0.375. Add this amount to the handle = 100.375. • Thus the market price is 100.375% of par or $1003.75
Current Yield • Since bond prices are likely to change, we often refer to a bond’s “current yield” which is measured by dividing a bond’s annual coupon payment by its current market price. • This provides us with a measure of the “current” interest yield obtained at the bond’s current market price (i.e., cost associated with investing in a particular bond). • Current yield = annual coupon payment/market price • Recall in our previous example, the 7 year, 1.50% bond selling at $1,003.75 (thus it is a premium bond). • Thus the current yield = $15.00/1,003.75 = 1.4944%
Current Yield for Bonds Selling at a Premium and at a Discount • Premium bonds: The current yield on these bonds will always be below the coupon yield. • Current Yield = Annual coupon payment/>$1,000 • Using the 1.5% coupon bond: • Current yield = $15.00/1,003.75 = 1.4944% • Discount bonds: The current yield on these bonds will always be above the coupon yield (assume a market price of $985). • Current Yield – Annual coupon payment/<$1,000 • Current yield = $15.00/$985 = 1.5228%
Yield to Maturity • Yield to maturity is the interest rate which will discount the incomes (i.e., cash-flows) of a bond to produce a present value which is equal to the bond’s current market price (or produce a net present value = 0). • Yield to maturity is calculated as: • MP = Market price of a bond (i.e., present value) • C = Coupon payments (a future cash flow) • PV = Par, or face value, at maturity (a future cash flow) • n = Years to maturity (as stated in the indenture) • i = Yield to maturity (the discount rate) • Note: i is also the bond’s internal rate of return
Yield to Maturity Example • Assume the following given variables:C =$40 (thus a 4.0% coupon issue; paid annually)N =10 PV =$1,000MP =$1,050 (note: premium bond, i.e., selling at a premium of par) • $1050 = $40/(1 + i)1 + $40/(1 + i)2 + . . . + $40/(1 + i)10 + $1000/(1 + i)10 • Solve fori, the yield to maturity • Note: The icalculated using this formula will be the return that you will be getting when the bond is held until it matures (and assuming that the periodic coupon payments are reinvested at the same i yield). • In this example, the calculated i is 3.4%.
Yield to Maturity Second Example • Now assume the following: • C =$40 N =10PV =$1,000MP =$900.00 (note: bond is selling at a discount of par) • $900 = $40/(1 + i)1 + $40/(1 + i)2 + . . . + $40/(1 + i)10 + $1,000/(1 + i)10 • Solve fori, the yield to maturity • Note: The icalculated in this example is 5.315%. • What one factor accounts for the yield to maturity difference when compared to the previous slide, with itsiof 3.4%?
Useful Web Site for Calculating a Bond’s Yield to Maturity • While yields to maturity can be determined through a book of bond tables or through business calculators, the following is a useful web site for doing so: • http://www.money-zine.com/Calculators/Investment-Calculators/Bond-Yield-Calculator/
Bloomberg.com Web Site for Yields to Maturity • Link to http://www.bloomberg.com/ to examine U.S. Government bonds. • Make sure you: • Understand the coupon column • Understand the maturity column (how much will a bond holder get on this date?) • Understand the price and yield column (looked at 2-year bonds down to 30-year bonds). • Note: Yield is the calculated yield to maturity. • Note: 3-month, 6-month and 12 month issues do not have a coupon (these are all Treasury Bills).
Treasury Obligations • The U.S. Treasury department sells a variety of debt instruments with different maturities. • T-Bills refer to those instruments with original maturities of 12 months or less. • T-Bills do not pay interest (i.e., there is no coupon yield). • Treasury notes and bonds are longer term debt instruments. • Notes out to about 7 years, and bonds out to 30. • These instruments pay interest (i.e., coupon issues). • Even though T-Bills do not pay interest, we still need to calculate a return on these instruments. • The two “yields” we calculate are the discount yield and the investment yield.
Discount and Investment Yield • Discount yields and investment yields are calculated for U.S. T-bills and other short term money market instruments (e.g., commercial paper and bankers’ acceptances) where there are no stated coupons (and thus the assets are quoted at a discount of their maturity value). • The discount yield relates the return to the instrument’s parvalue (or face or maturity). • The discount yield is sometimes called the bank discount rate or the discount rate. • The investment yield relates the return to the instrument’s current market price. • The investment yield is sometimes called the coupon equivalent yield, the bond equivalent rate, the effective yield or the interest yield.
The Discount Yield • Discount yield = [(PV - MP)/PV] * [360/M] • PV = par (or face or maturity) value • MP = market price • M = maturity of bill. • Note: 360 = is the number of days used by banks to determine short-term interest rates on discounted instruments. • The discount yield relates the return to the instrument’s par value (PV).
Discount Yield Example • What is the discount yield for a 182-day T-bill, with a market price of $965.93 (per $1,000 par, or face, value)? • Discount yield = [(PV - MP)/PV] * [360/M] Discount yield = [(1,000) - (965.93)] / (1,000) * [360/182]Discount yield = [34.07 / 1,000] * [1.978022]Discount yield = .0673912 = 6.74%
Investment Yield • Investment yield = [(PV - MP)/MP] * [365 or 366/M] • The investment yield relates the return to the instrument’s current market price (MP). • In addition, the investment yield is based on a calendar year: 365 days, or 366 in leap years. • The investment yield is generally calculated so that we can compare the return on T-bills to “coupon” investment options. • Since the calculated investment yield is comparable to the yields on coupon bearing securities (such as long term bonds and notes) it is often referred to as the bond or coupon equivalent yield.
Investment Yield Example • What is the investment yield of a 182-day T-bill, with a market price of $965.93 per $1,000 par, or face, value? • Investment yield = [(PV - MP)/MP] * [365/M]Investment yield = [(1,000 – 965.93) / (965.93)] * [365/182]Investment yield = [34.07] / 965.93] * [2.0054945]Investment yield = .0707372 = 7.07%
Discount and Investment Yields • Looking at the last two examples we found: • Discount yield = [(PV - MP)/PV] * [360/M] Discount yield = [(1,000 - 965.93)] / (1,000) * [360/182]Discount yield = [34.07 / 1,000] * [1.978022]Discount yield = .0673912 = 6.74% • Investment yield = [(PV - MP)/MP] * [365/M]Investment yield = [(1,000 – 965.93)] / (965.93) * [365/182]Investment yield = [34.07 / 965.93] * [2.0054945]Investment yield = .0707372 = 7.07% • Note: The investment yield formula will tend to “over-state” yields relative to those computed by the discount method, because the market price (in the investment yield formula) is (likely to be) lower than the par value ($1,000). • However, if the market price is very close to the par value, the yields will be very close to one another.
Bloomberg.com Web Site for Discount and Investment Yields • Link to http://www.bloomberg.com/ to examine U.S. Government bonds. • Look at the 3-month, 6-month and 12-month issues. • Observe they do not carry a coupon. • Observe they sell at a discount (of par). • Under the column price/yield you will observe two yields. • The first yield (under price) is the discount yield. • The second yield (under yield) is the investment yield.
What Changes The Yield to Maturity? • Think of the yield to maturity as the “required return on an investment.” • Since the required return changes over time, we can expect these changes to produce inverse changes in the prices on outstanding (seasoned) bonds. • Why will the required return change over time? • Changes in inflation (inflationary expectations). • Changes in the economy’s credit conditions resulting from change in business activity. • Changes in central bank policies. • Generally, impacting on shorter term maturities (exception, Operation Twist). • Changes in the assumptions about credit risk and announced changes in credit risk ratings associated with the issuer of the bond(i.e., risk of default). • Contagion effects • Safe haven effects (market uncertainty)
Illustrating the Relationship Between Interest Rates and Bond Prices • Assume the following: • A 10 year corporate Aaa bond which was issued 8 years ago (thus it has 2 years to maturity) has a coupon rate of 7%, with interest paid annually. • Thus, 7% was the required return when this bond was issued. • This bond is referred to as an outstanding (or seasoned) bond. • Question: How much will a holder of this bond receive in interest payments each year? • This bond has a par value of $1,000. • Question: How much will a holder of this bond receive in principal payment at the end of 2 years?
What Happens when Interest Rates Rise? • Assume, market interest rates rise (i.e., the required return rises) and now 2 year Aaa corporate bonds are now offering coupon returns of 10%. • This is the “current required return” (or “i” in the present value bond formula) • Question: What will the market pay (i.e., market price) for the outstanding 2 year, 7% coupon bond noted on the previous slide? • PV = $70/(1+.10) + $1,070/(1+.10)2 • PV = $947.94 (this is today’s market price) • Note: The 2 year bond’s price has fallen below par (selling at a discount of its par value). • Conclusion: When market interest rates rise, the prices on outstanding bonds will fall.
What Happens when Interest Rates Fall? • Assume, market interest rates fall (i.e., the required return falls) and now 2 year Aaa corporate bonds are now offering coupon returns of 5%. • This is the “current required return” (or “i” in the present value bond formula) • Question: What will the market pay (i.e., market price) for the outstanding 2 year, 7% coupon bond? • PV = $70/(1+.05) + $1,070/(1+.05)2 • PV = $1,037.19 (this is today’s market price) • Note: The 2 year bond’s price has risen above par (selling at a premium of its par value). • Conclusion: When market interest rates fall, the prices on outstanding bonds will rise.
Bond Price Sensitivity to Changes in Market Interest Rates (YTM)
Change in Market’s Required Return Versus Change in Market Demand • The examples on the previous slides demonstrated the impact of a change in the market’s required return on bond prices. • Observation: Cause – effect relationship runs from changes in required return to changes in market prices (which produce the market’s new required return). • However, it is possible for a change in market demand to produce changes in bond prices and thus in market interest rates. • For example: Safe haven effects result in changes in demand for particular assets. • Observation: Cause – effect relationship runs from changes in demand to changes in prices (which have an automatic impact on yields).
What if the Time to Maturity Varies? • Assume a one year bond (7% coupon) and the market interest rate rises to 10%, or falls to 5%. • PV@10% = $1,070/(1.10) • PV = $972.72 • PV @5%= $1,070/(1.05) • PV = $1,019.05 • Now assume a two year bond (7% coupon) and the market interest rate rises to 10%, or falls to 5% • PV@10% = $70/(1+.10) + $1,070/(1+.10)2 • PV = $947.94 • PV@5% = $70/(1.05) + $1,070/(1+.05) 2 • PV = $1037.19 • Conclusion: For a given interest rate change, the longer the term to maturity, the greater the bond’s price change.
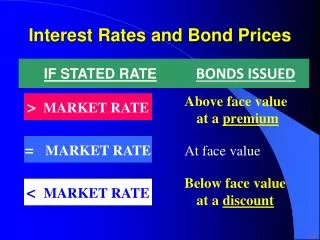
Summary: The Interest Rate Bond Price Relationship • #1: When the market interest rate (i.e., the required rate) rises above the coupon rate on a bond, the price of the bond falls (i.e., it sells at a discount of par). • #2: When the market interest rate (i.e., the required rate) falls below the coupon rate on a bond, the price of the bond rises (i.e., it sells at a premium of par) • IMPORTANT: There is an inverse relationship between market interest rates and bond prices (on outstanding or seasoned bonds). • #3: The price of a bond will always equal par if the market interest rate equals the coupon rate.
Summary: The Interest Rate Bond Price Relationship Continued • #4: The greater the term to maturity, the greater the change in price (on outstanding bonds) for a given change in market interest rates. • This becomes very important when developing a bond portfolio-maturity strategy which incorporates expected changes in interest rates. • This is the strategy used by bond traders: • What if you think interest rates will fall? Where should you concentrate the maturity of your bonds? • What if you think interest rates will rise? Where should you concentrate the maturity of your bonds?
Interest Rate (or Price) Risk on a Bond • Defined: The risk associated with a reduction in the market price of a bond, resulting from a rise in market interest rates. • This risk is present because of the “inverse” relationship between market interest rates and bond prices. • The longer the maturity of the fixed income security, the greater the risk and hence the greater the impact on the overall return. • For a historical examples, see the next slide.
Relationship of Maturity to Returns • Note: Return = coupon + change in market price
Reinvestment Risk on a Bond • Reinvestment risk occurs because of the need to “roll over” securities at maturity, i.e., reinvesting the par value into a new security. • Problem for bond holder: The interest rate you can obtain at roll over is unknown while you are holding these outstanding securities. • Issue: What if market interest rates fall? • You will then re-invest at a lower interest rate then the rate you had on the maturing bond. • Potential reinvestment risk is greater when holding shorter term fixed income securities. • With longer term bonds, you have locked in a known return over the long term. • For a historical example, see the next slide
Other Risk Associated with Bonds • Inflation Risk: • Risk the future “unanticipated” inflation will erode the real value of future payments. • Can reduce this risk through inflation protected instruments (TIPs in the U.S.) • Default Risk: • Risk that the issuer of the bond will encounter financial difficulties which will render coupon and principal payments difficult (or impossible). • Can “insure” against default with credit default swaps.
Standard & Poor’s Annual Default Data • In 2011, 53 global corporate issuers defaulted, down from 81 defaults in 2010 and the record high of 265 in 2009. • U.S. companies accounted for the majority of defaults, with 39, while other developed nations had seven (Europe accounted for four). • The debt amount affected by these 53 defaults fell to $84.2 billion, from $95.7 billion in 2010 (All-time high of $627 billion in 2009). • •Texas Competitive Electric Holdings Co. was the single largest defaulter in 2011 based on debt volume. The company accounted for $32.46 billion in debt, which is nearly 40% of the total amount affected by defaults in 2011. • Data based on the 15,299 companies that Standard & Poor's rated up to Dec. 31, 2011.
Sovereign Defaults • The term sovereign default refers to the failure of a government to comply with interest payment or debt repayment obligations on its bonds or bank loans. • Before the 19th century, sovereign defaults arose mainly from domestic politics or wartime refusal to make payments to enemy creditors. • In the early 20th century, defaults were mainly associated with the First World War or with the great depression. • There were relatively few post-war defaults until the 1980s. However, from 1980 to 2004 there were over 110 default and debt restructuring episodes involving African and South American governments. Most of these were related to a combination of external shocks (e.g., a currency crisis) or a banking or currency crises. • In most cases, a sovereign default is followed by a restructuring agreement (e.g., the Paris Club) between the defaulting government and its creditors, and the resumption of payments. • Greece (February 21, 2012): Private bond holders agreed to a 53.5% “haircut” on the nominal value of their Greek bonds.
Cycles of Sovereign Defaults • Percent of Countries in Default or Restructuring
Hedging with Credit Default Swaps • CDS are financial instruments used for swapping the risk of debt default. A credit event occurs when there is a substantial, identifiable loss. • The buyer of a credit default swap pays a premium for effectively insuring against a debt default. The buyer receives a lump sum payment if the debt instrument is defaulted. Swaps pay the buyer face value should a borrower fail to adhere to its debt agreements. The buyer of a credit swap receives credit protection, whereas the seller of the swap guarantees the credit worthiness of the product. By doing this, the risk of default is transferred from the holder of the fixed income security to the seller of the swap. • CDS are quoted in basis points. A basis point equals $1,000 annually on a swap protecting $10 million of debt. • Credit events applicable to governments are failure to pay on the debt or restructuring of the debt. Generally speaking, a restructuring involves reduced payments or payments that are spread over time without compensation. • CDS spreads can be interpreted as a measure of the perceived risk that a government will restructure or default on its debt.
Appendix 2 PIIGS Interest Rates Pre and During Debt Crisis
Run Up to the February 21, 2012 Greek Sovereign Debt Re-Structuring • Yields to Maturity on 2-Year Greek Government Bonds