
Impacts of Ozone Concentrations on Health and Environmental Risks in the U.S.
This study investigates the excess risk associated with observed ozone (O3) concentrations above background levels in the United States. It evaluates the implications for human health and air quality policy, considering both natural and anthropogenic contributions. The research highlights significant variability in surface ozone background levels based on seasonal and spatial factors, revealing that established background levels may underestimate health risks. Findings suggest that current EPA standards for ozone may be too lenient and call for reconsideration of background concentration definitions.

Impacts of Ozone Concentrations on Health and Environmental Risks in the U.S.
E N D
Presentation Transcript
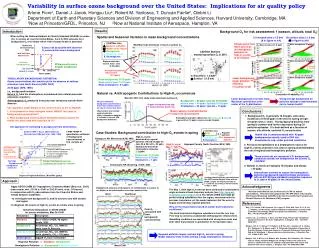
Health and Environmental Risk Excess risk associated with observed O3 concentration above background total risk from observed O3 risk from background O3 risk from natural O3 levels 10 40 observed Ozone (ppbv) Variability in surface ozone background over the United States: Implications for air quality policy Arlene Fiore1, Daniel J. Jacob, Hongyu Liu2, Robert M. Yantosca, T. Duncan Fairlie2, Qinbin Li Department of Earth and Planetary Sciences and Division of Engineering and Applied Sciences, Harvard University, Cambridge, MA 1Now at Princeton/GFDL, Princeton, NJ 2Now at National Institute of Aerospace, Hampton, VA Results Introduction Background O3 for risk assessment: f (season, altitude, total O3) When setting the National Ambient Air Quality Standard (NAAQS) for ozone (O3) in surface air over the United States, the U.S. EPA accounts for a background O3 level above which risk to human health is assessed. Spatial and Seasonal Variation in mean background concentrations 12 elevated sites (>1.5 km) (X in figure to left) 58 surface sites (<1.5 km) ( in figure to left) CASTNet sites Model at CASTNet Model entire region Background Natural O3 level Stratospheric Enhancement from North American (& hemispheric) pollution for high-O3 events in all seasons * Monthly mean afternoon (1-5 p.m.) surface O3 Mean background: 27 ppbv Mean background: 36 ppbv CASTNet Stations measuring surface O3 in 2001 + { X { Mean background: 23 ppbv Mean background: 30 ppbv Regional pollution from N. Amer. emis. (8-30 ppbv) EPA presently uses a 40 ppbv background Regional Pollution Ozone (ppbv) Hemispheric pollution enhancement (5-12 ppbv) { Elevated (> 1.5 km) Surface (<1.5 km) X { Mean background: 23 ppbv Lower background; larger pollution influence in summer & fall Mean background: 30 ppbv “REGULATORY BACKGROUND” DEFINITION: Ozone concentrations that would exist in the absence of anthrop. emissions from North America [EPA, 2003] 25-45 ppbv [EPA, 1996] i.e., background includes: Natural O3 from the stratosphere or produced from natural precursor emissions anywhere Anthropogenic O3 produced from precursor emissions outside North America Mean background: 20-35 ppbv Mean natural level: 13-27 ppbv Mean stratosphere: 2-7 ppbv Natural vs. Anthropogenic Contributions to High-O3 occurrences Cumulative Probability (%) Mar-Oct 2001 U.S. daily mean afternoon surface O3 Lower background at surface sites; Maximum contribution at the center of the O3 distribution Using average background for pollution episodes underestimates risk to human health! Background < 50 ppbv; typically 20-35 ppbv Natural level < 40 ppbv; typically 10-25 ppbv Stratosphere < 20 ppbv; typically < 10 ppbv Why are simulated background concentrations lower than estimates based on obs at remote/rural sites? Observations may contain regional pollution. (Note: hemispheric pollution is included in current EPA background definition.) 40 ppbv background too high underestimates health risk • Two questions under debate in the current review of the O3 NAAQS: • 1. Is the present (or more stringent future) NAAQS too close to • background concentrations? • 2. What background concentrations should be used to assess the • health risk associated with exposure to O3? Conclusions Model captures overall distribution of observed concentrations 1. Background O3 is generally 15-35 ppbv, with some incidences of 40-50 ppbv in the west in spring at high-elevation sites (> 2km). The background declines from spring to summer and further decreases during O3 pollution episodes. It is best defined as a function of season, site altitude, and total O3 concentration Hemispheric pollution (difference of background & natural) is generally 4-12 ppbv, rarely exceeds 20 ppbv. One approach for estimating O3 background from observations CASTNet sites Model Background Natural O3 level Stratospheric * Large range in quantitative estimates of background concentrations in U.S. surface air Case Studies: Background contribution to high-O3 events in spring Summer 1995 1- 5 p.m. observations at Harvard Forest [Munger et al., 1996, 1998] Regional pollution } D = Health risk is underestimated with 40 ppbv background presently used in EPA risk assessments, esp. under polluted conditions } High-O3 events: dominated by regional pollution (44 and 50 ppbv on June 26 & 29) with < 30 ppbv background and minor stratospheric influence (~2 ppbv) D = + Hemispheric pollution Voyageurs NP, Minnesota (93W, 48N) X High-O3 event May 1, 2000 Haywood County, North Carolina (83W, 35N) 2. Previous interpretations of a stratospheric source for high-O3 events at western U.S. sites in spring underestimated the role of regional and hemispheric pollution. U.S. Ozone Standard background presently used in EPA risk assessments Frequently observed surface O3 concentrations attributed to natural background by Lefohn et al. [2001] 2000 Ozone (ppbv) Background: 15-36 ppbv Natural level: 9-23 ppbv Stratosphere: < 7 ppbv These events do not represent U.S. background conditions and do not compromise the current O3 standard. Intercept 30 ppb background (clean air) Range of background that was considered for revised O3 standard Yellowstone NP, Wyoming (110W, 45N) O3 produced in continental lower trop 3. Natural O3 levels are typically 10-25 ppbv and always < 40 ppbv. 2001 International controls to reduce the hemispheric pollution background would facilitate compliance with an AOT40-type standard (cumulative exposure to O3 above 40 ppbv) in the United States. Range of Observed Background (Pollution coordinate) Degree of Regional Pollution (NOy-NOx (ppbv)) Isentropic back-trajectory calculated from the GEOS meteorological fields with the NASA Langley 3-D trajectory model at T = 300K for air arriving in North Carolina on May 1, 2000. Approach Acknowledgments • Apply GEOS-CHEM 3D Tropospheric Chemistry Model [Bey et al., 2001] • (uses assim. met.; 20-30 s; 4ºx5º or 2ºx2.5º horiz. resn., 24 tracers) • in conjunction with O3 observations from the Clean Air Status and • Trends Network (CASTNet): • to investigate how background O3 and its sources vary with season • and region • to diagnose the source of high-O3 events at remote sites in spring Background, natural & stratospheric O3 contributions to surface O3 are higher at elevated western sites than eastern sites. The May 1, 2000 high-O3 event has been attributed to stratospheric origin on basis of back-trajectory analysis [see http://www.asl-associates.com/ncreport.htm]. The GEOS-CHEM met fields do predict strong subsidence over the region, consistent with the previous trajectories, yet the model indicates that the event is largely controlled by regional pollution. We thank David McKee and Joe Pinto at U.S. EPA for helpful conversations. This work was supported by The EPA Office of Air Quality Planning and Standards (OAQPS) under the Intercontinental Transport and Climatic Effects of Air Pollutants (ICAP) program. West Southeast References Why are the intepretations based on similar back-trajectories so different? • Bey, I., D.J. Jacob, R.M. Yantosca, J.A. Logan, B. Field, A.M. Fiore, Q. Li, H. Liu, L.J. Mickley, and M. Schultz, Global modeling of tropospheric chemistry with assimilated meteorology: Model description and evaluation, J. Geophys. Res., 106, 23,073-23,096, 2001. • Lefohn, A.S., S.J. Oltmans, T. Dann, and H.B. Singh, Present-day variability of background ozone in the lower troposphere, J. Geophys. Res., 106, 9945-9958, 2001. • Munger, J.W., S. C. Wofsy, P. S. Bakwin, S.-M. Fan, M. L. Goulden, B. C. Daube, A H. Goldstein, K. E. Moore, and D. R. Fitzjarrald, Atmospheric Deposition of Reactive Nitrogen Oxides and Ozone in a Temperate Deciduous Forest and a Sub-arctic Woodland. 1. Measurements and mechanisms, J. Geophys. Res. 101, 12,639-12,657, 1996. • Munger, J.W., S-M. Fan, P.S. Bakwin, M.L. Goulden, A.H. Goldstein, A.S. Colman, and S.C. Wofsy, Regional budgets for nitrogen oxides from continental sources: Variations of rates for oxidation and deposition with season and distance from source regions, J. Geophys. Res. 103, 8355-8368, 1998. Peak O3 associated with lower background concentrations Sensitivity Simulations in GEOS-CHEM for source attribution; Mar-Oct 2001 • The back-trajectories diagnose subsidence from the free trop. • Free-trop O3 contains a substantial anthropogenic enhancement. • Subsiding conditions are associated with strong inversions and • clear skies that promote O3 production in the boundary layer. Regional pollution largely controls high-O3 events in spring; Model explains these events without a large stratospheric influence. Regional Pollution = Standard – Background Hemispheric Pollution = Background – Natural O3 level March 2001


