Download
1 / 39
400 likes | 600 Vues
This guide provides an overview of the Consumer Price Index (CPI) as compiled by the U.S. Bureau of Labor Statistics. It explains the CPI's role in measuring price changes over time for a basket of goods and services, its various applications, and the different population groups it covers. The document also addresses how the CPI is utilized in economic indicators, contract escalations, and adjustments in income payments. Key details about the CPI market basket, major expenditure categories, and the importance of accurate data collection are covered.

E N D
The Consumer Price Index:A User’s Guide Kara Markley Erin Delaney Mid-Atlantic Information Office May 19, 2014
BLS data • The U.S. Bureau of Labor Statistics (BLS) collects, analyzes and publishes data on our economy and our society. • Inflation, prices, and spending • Employment and unemployment • Pay and benefits • Workplace injuries and fatalities • Productivity
BLS stakeholders • BLS data is widely used by: • Government policy makers • Media • Employees • Managers • Business owners • Consumers • Students • Job seekers
Presentation overview • What is the CPI? • Uses of the CPI: • Contract escalation • Other common CPI calculations • Website tutorial
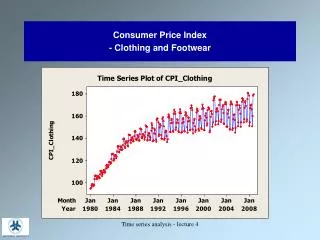
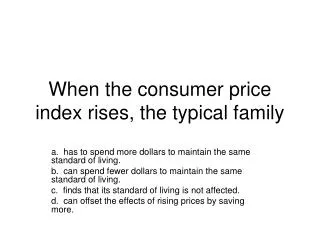
Consumer Price Index:The buyer’s perspective • The CPI measures change over time in the prices paid by urban consumers for a representative basket of goods and services • The CPI is themost widelyused measureof price change
CPI population groups • All Urban Consumers (CPI-U): about 88% of the total U.S. population • Urban Wage Earners and Clerical Workers (CPI-W): a subset of the CPI-U population; about 29% of the U.S. total
Index: The “I” in “CPI” • Index numbers show change over time from a base period, which is defined as 100.0 • For example, an increase of 7.0 percent from the base period is shown as 107.0 • Index numbers are not dollar values • Index value changes are relative and depend on the base period • Percent changes must be used to interpret index movements
The CPI market basket • Developed from detailed information on actual purchases by families and individuals • Based on Consumer Expenditure Survey • About 7,000 families from around the country participated each year: • Quarterly interviews about significant purchases • Diaries listing every purchase during 2-week periods
CPI major expenditure categories Food and Beverages Apparel Housing Transportation Education & Communication Other Goods & Services Medical Care Recreation
CPI relative importance • Expenditure weight of a CPI component as a percent of all items • Reflect actual distributions based on consumer expenditures • Based on 2011-12 weights as of December 2013 • Revised every two years to reflect changes in the economy such as: • Income • Climate & weather patterns • Family size • Goods & services in the marketplace
Also included in the CPI: • Various government-charged user fees: • Water and sewerage charges • Auto registration fees • Vehicle tolls • Taxes directly associated with the prices of specific goods and services: • Sales taxes • Excise taxes
Excluded from the CPI: • Taxes not directly associated with the purchase of consumer goods and services: • Income taxes • Social Security taxes • Investment or savings items: • Stocks & bonds • Real estate • Life insurance
Publication • Publication • CPI-U All Items U.S. City Average for all urban consumers is the monthly headline figure reported in the news. • 3 indexes are highlighted: • Food • Energy • All items less food and energy: often referred to as the “core” inflation index, removes the more volatile food and energy price changes • Also published each month are CPI-W, CPI-E, and Chained CPI-U.
What is the C-CPI-U? • The Chained Consumer Price Index for All Urban Consumers (C-CPI-U) is a variation of the CPI-U that matches changing purchasing habits with prices recorded for items each month. • First produced in 2002, data back to January 2000 (December 1999=100). • Differs from the CPI-U in both weighting and formula • Reflects the effect of substitution that consumers make across item categories in response to changes in relative prices • The key strength of the C-CPI-U is that it is a closer approximation of a true cost-of-living index in that it reflects changes in consumer spending patterns across CPI item categories every month.
Uses of CPI data Economic Indicator Deflator of Other Economic Data Adjusting Income Payments Contract Escalation
CPI as a basis for contract escalation • Contractual agreements often use the CPI to escalate or adjust payments • Private sector collective bargaining agreements • Rental contracts • Insurance policies with inflation protections • Alimony and child support payments
Percent change formula CPIc − CPIp x 100 CPIp CPIc = CPI for current period CPIp = CPI for previous period
Percent change example Now, calculate the 12-month percent change from March 2013 to March 2014.
Calculating percent change Computation of percent change: CPIc 154.600 Less CPIp 152.188 Equals index point change 2.412 Divided by CPIp 2.412 / 152.188 Equals 0.0158 Results multiplied by 100 0.0158 X 100 Equals percent change1.6
Unpublished percent change Now try something that’s not in the database: Calculate the percent change from March 2011 to March 2014.
Check your work 236.293 − 223.467 x 100 223.467 Percent change, March 2011–March 2014 = 5.7%
Get out your calculator… Escalation exercise: Office Space
Exercise: Office Space A software business, Initech, leases some office space in a privately owned building next door to Initech. Currently, Initech is renting the space for $5,000/mo. It is your job to make the budget entry for this leased space for the next fiscal year. The lease states that the rent will be adjusted each year on September 1, by the 12-month percent increase in the CPI-U, Washington-Baltimore, All Items, Not Seasonally Adjusted, for July of that same year and shall not exceed 3%. Calculate what the new monthly rent will be when the lease is renewed on September 1, 2013.
Exercise: Office Space • $5,000 x .019 = $95 increase for September 2013 • September 2013 rent = $5,000 + $95 = $5,095
CPI guidelines for escalation General guidelines: • DEFINE clearly the base payment to be escalated • IDENTIFY precisely which CPI index series will be used to escalate the base payment • SPECIFY a reference period from which changes in the CPI will be measured
CPI guidelines for escalation General guidelines (continued): • STATE the frequency of adjustment • DETERMINE the formula for the adjustment calculation • PROVIDE a built-in method for handling a major CPI revision or change in the CPI index base period
Get out your pen and imagination… Write your own contract exercise:My Favorite Things
Exercise: My Favorite Things • Take a moment to think about your favorite things… what’s something you’d never want to run out of? • Using the guidelines that we just reviewed, write your own escalation clause to be used in a contract for the ongoing purchase of one of your favorite things, so you won’t have to be without it. You can refer to the guidelines on slides 26 and 27 of the presentation to help you. • When you’re done, look back over the clause you’ve written. Is it clear and easy to follow? Does it leave anything open for interpretation or dispute? How is it similar to the one you use at work, and how is it different?
Other calculations and special circumstances* • Annual average • Purchasing power • Constant dollars • Conversion to other base periods • Discontinued indexes and publication changes *More information on these concepts and others can be found at: http://www.bls.gov/cpi/cpimathfs.pdf
Annual average • BLS publishes the average CPI for the calendar year • Sum of the 12 monthly data points, divided by 12
Constant dollars • Use the CPI to “deflate” current (nominal) dollars into constant (real) dollars • CPIr / CPInx Value (U.S. annual averages) • Consider the following salary progression: Nominal Real (2002 dollars) 2002: (179.9/179.9) x $40,000 = $40,000 2007: (179.9/207.3) x $45,000 = $39,052 2012: (179.9/229.6) x $50,000 = $39,177
Purchasing power • When prices rise, the same dollar buys less. Use the CPI to determine how much less. • CPId / CPIp x 100 • Example: What was the purchasing power of a 2002 dollar in 2012? (U.S. annual averages) • 179.9 / 229.6 x 100 = 78.4 • In 2012, a 2002 dollar buys 78.4% of its original value, or 78.4 cents CPId = CPI for the year of your “dollar” CPIp = CPI for the “purchasing power” year
Conversion to other base periods • Some contracts may use a reference base that is no longer published • Contact the BLS for the specific rebasing factor needed • Rebasing factors are unique to their index series and cannot be substituted
Discontinued indexes and publication changes • It is possible that a specified index may go out of publication during a contract • Both parties must agree upon an index to replace the discontinued (original) one • The percent change cannot be calculated directly, but can be performed in two steps
Let us show you around. www.bls.gov
Kara MarkleyErin DelaneyMid-Atlantic Information Officewww.bls.gov/ro3215-597-3282blsinfophiladelphia@bls.gov