Download
1 / 34
340 likes | 363 Vues
Explore the latest updates on tools for State Implementation Plan (SIP) writers, training sessions, and upcoming developments in the Western United States. Attend the demo of selected tools for better visibility and information exchange.

E N D
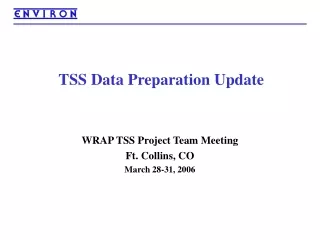
TSS Project Update and Demo of Selected Tools WRAP IWG Meeting Santa Fe, NM December 7, 2006
WRAP Technical Information Centers TSS Overview Status of TSS functionality Future TSS work TSS training Demo of selected TSS tools Outline
WRAP Technical Information Centers Visibility Information Exchange Web System (VIEWS): VIEWS provides on-line access to monitoring data, research results and special studies related to visibility. http://vista.cira.colostate.edu/views/ Regional Modeling Center: The WRAP’s Regional Modeling Center at the University of California Riverside provides state and tribal agencies with sophisticated modeling of regional haze in the Western United States. http://pah.cert.ucr.edu/aqm/308/ Emissions Data Management System: An emission inventory data warehouse for states and tribes. The system provides a consistent, complete and regional approach to emissions data management and tracking. http://www.wrapedms.org/ Causes of Haze Assessment: A detailed analysis of ambient monitoring data for regional haze in the WRAP region. http://www.coha.dri.edu/ The Technical Support System integrates a number of different information resources under one web-based umbrella. http://vista.cira.colostate.edu/tss
TSS url: http://vista.cira.colostate.edu/tss/ TSS focus has been to prepare tools to support SIP writers’ needs Dynamic tools – interactive, based on data queries Graphs Tables Maps Static tools – analyses/products generated outside of the TSS, often placeholders for planned dynamic tools Recent work incorporates Tribal areas in tools Where possible, data tables have been made available for download so analysts can examine data and reformat graphics as required TSS Overview
Green – Substantially functional, results or information generally available Yellow – Functional, but somewhat incomplete at this time Red – Not substantially functional or complete Status of TSS Functionality
On-going site evolution and tool development TSS training anticipated: 2 WebEx style sessions (early 2007) 1 classroom style session (spring 2007) TSS data updates: Emissions updates (mid-2007) Results from control strategy modeling (mid-2007) IMPROVE data updates for 2005 and 2006 TSS linkage with other web sites/data nodes: Fire Emissions Tracking System (FETS) Emissions Data Management System (EDMS) Future TSS Work
Early 2007 – set tentative dates today? WebEx style – no travel required 60-90 minutes Use well-defined syllabus Session 1: Go through entire WOE Checklist? Session 2: Explore source attribution tools? Will request that IWG participants do some homework prior to each session Review of specific documents on the TSS Review of tools included in the syllabus so that participants will have some specific questions TSS Training
Demo of Selected TSS ToolsFollowing slides contain notesto be covered in the demoRed text = left hand navigation bar “clicks”
Resources/Emissionshttp://vista.cira.colostate.edu/TSS/Results/Emissions.aspxResources/Emissionshttp://vista.cira.colostate.edu/TSS/Results/Emissions.aspx Summaries: Downloadable Excel spreadsheets Annual and seasonal State and county WRAP and entire RPO domain Emissions Summaries
Resources/Monitoring/Analysis Resultshttp://vista.cira.colostate.edu/TSS/LinkBrowser/LinkBrowser.aspx?action=baseline Select “Model Response and Preliminary Glide Slope Calculations” Summaries: Graphs Model response (2018 – baseline results) for worst days Preliminary glide slope with predicted 2018 value Old IMPROVE Algorithm Default natural conditions Final numbers will change, but general results not expected to differ significantly at most sites 2018 Proj./Glide Slope Calculation (1)
Resources/Weight of Evidencehttp://vista.cira.colostate.edu/TSS/Tools/WOEChecklist.aspx Select a site under the “Start” tab Select the “Class I Area” tab Scroll down to “Reasonable Progress Goal” Select 3rd bullet (species glide slopes) Summaries: Graphs and data Species glide slopes New IMPROVE Algorithm New natural conditions Does not yet display the 2018 projected values 2018 Proj./Glide Slope Calculation (2)
Resources/Weight of Evidencehttp://vista.cira.colostate.edu/TSS/Tools/WOEChecklist.aspx Select the “Class I Area” tab Scroll down to “Class I Area Summary Table” Select 1st (only) bullet Summaries: Not yet implemented – sample table next slide Does sample table meet IWG needs? Tabular Summary of WOE Results
Tabular Summary of WOE Results – SAMPLE* *Courtesy of Lee Alter
Resources/Emissions (emissions graphs) http://vista.cira.colostate.edu/TSS/Results/Emissions.aspx Resources/Monitoring/Monitoring Data Browserhttp://vista.cira.colostate.edu/TSS/Tools/MonitoringData.aspx Select the “Time Series” tab Tool selections include: Mass or extinction Old or new IMPROVE algorithm Various time and averaging periods Annual/Seasonal Pollutant Graphs
Resources/Monitoring/Monitoring Data Browserhttp://vista.cira.colostate.edu/TSS/Tools/MonitoringData.aspx Select the “Time Series” tab Choose: “worst 20%”, “daily”, years 2000-2004 Copy/download data Same page; select “Source Apportionment” and then “Organic Aerosol Tracer” tabs Results show contribution to organic carbon of: Anthropogenic secondary OC (man-made VOCs and fire) Biogenic secondary OC (natural VOCs and fire) Anthropogenic AND biogenic primary OC (fire; other) Full analysis would include knowing periods of wildfire impact Exploration of a “Fire Signature”
Short answer: NO AQ model required to predict visibility from changes in emissions Data mining may help understanding of emissions/extinction Review PSAT and WEP results to identify relative contributions from source regions Tool For Emissions Rollback? (1)
Resources/Area of Interest http://vista.cira.colostate.edu/TSS/Tools/Results.aspx Select the “Source Apportionment”, then “SOx NOx Tracer” or “Weighted Emissions Potential” tabs “SOx NOx Tracer” provides PSAT concentration attribution results Select “2 – By Region” to identify most important source areas Select “1 – Time Series” to determine seasonal impact of source areas “Weighted Emissions Potential” (WEP) provides a back trajectory residence time and distance weighting to emissions sources Select map graphic of emissions densities, residence times, or WEP results Select Excel file to see relative “contributions” by source types and categories Tool For Emissions Rollback? (2)
Black Canyon is represented by the Weminuche (WEMI) IMPROVE site Review PSAT results for WEMI; identify relative contribution from Utah (how do they change in 2018?) Review seasonality of Utah impacts (Currently there are no Weighted Emissions Potential maps for this site) How does Utah impact Black Canyonof the Gunnison, CO?
Zion is represented by the ZION IMPROVE site Review PSAT results for ZION; identify relative contribution from Nevada What are the dominant source categories? Review seasonality of Nevada impacts Review the Weighted Emissions Potential (WEP) maps and spreadsheets for this site How does Nevada impact Zion, UT?
WEP – Emissions and Residence Time NOx Emissions Residence Time
WEP – NOx, SOx, PEC Results NOx Results SOx Results PEC Results