Download
1 / 48
480 likes | 575 Vues
Analyzing math and English placement trends at LPC from 1998-2008, focusing on enrollment rates, gender and race demographics, and time to take and success rates for courses.

E N D
Report to the LPC Basic Skills CommitteeOffice of Institutional Research and PlanningAmber Machamer and Nicole HolthuisNovember 11, 2009
Research on Math and English Placement Trends and Subsequent Course Enrollment • Placement Trends over Time (1998 – 2008) • Placement Trends with Demographics • “Time to Take”: Enrollment and Success Rates • Who are the “Technically Un-assessed” • Potential vs Actual Enrollment • * Please see last slides for wrap up of dialogue that followed and next Steps
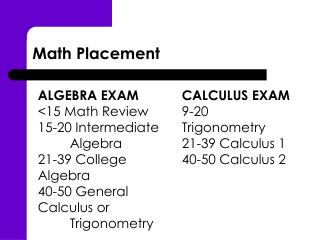
Math Placement Trends Over Time:Highlights Methodology: Focused on placement of self-reported “new” students at LPC from 1998 to 2008 who assessed between the expected window of March to August prior to their Fall enrollment. • From 1998 to 2008, placement into Math 107 declined from 20% to 5% • Placement into Math 55 has increased from 15% to 21% • Percentage of students placed into Math 65 has not significantly changed over the 10 year period • This shift is most dramatic starting in 2005
English Placement Trends Over Time:Highlights • Percentage of students placed into English 100/104 has increased over time from 38% to 46% (in contrast to math, where placement in Math 107 decreased over time) • Percentage of students placed into English 1A has decreased from 27% to 19% (also in contrast to math) • Again, a significant shift occurred in 2005
Math Placement Demographics 98 - 08: Highlights Methodology: Analysis of the same 98 to 08 placement data of new students by gender and race. No significant changes over time in placement by gender and race so the 10 years were collapsed. • Gender: Enrollment at LPC is essentially 50:50 males to females. However, we see significant gender differences in placement into: • college level and math 55; males higher than expected • math 107; females higher than expected • Ethnicity: • Hispanics are “under-placed” into college level math while whites and Asians are “over-placed.” • Hispanic students are more likely to not assess • African-Americans and Hispanics are “over-placed” in math 107.
English Placement Demographics 98 - 08: Highlights • Gender • Eng placement is roughly proportional by gender except for ESL where females are “over-placed” • Ethnicity • White students are “over-placed” into 1A. • African-American students “over-placed” into Learning Skills • Placement into 100A/104 is roughly equitable • Majority of ESL students are Asian and Hispanic • As with Math, Hispanic students are less likely to get assessed.
Math: “Time to Take” EnrollmentsHighlights Methodology: Followed 4 cohorts of students (F03 to F08), their placement, and subsequent math enrollment/success in said course • The vast majority of students who are placed take the recommended course within 2 semesters • This is true for all levels • If they did not take the first year they are highly unlikely to take it • This is NOT true for those who did not assess in the expected pattern
Math: “Time to Take” Success RatesHighlights There is little relationship between how soon they took the course and success Partly due to lack of variability in time to take Variations in success rates in the later 4 semesters are due to very small numbers in those semesters (outliers)
English “Time to Take”:Highlights • Eng time to take shows the same pattern as math • Most take the recommended course in 1st semester, although 2nd and 3rd semesters slightly higher than math • Basic skills seems to have a slightly longer “time to take,” with 20% taking it in the 2nd semester • Possible concerns over availability of 100A/104 • Those who did not assess in expected pattern show poor rates of course taking
English “Time to Take”:Highlights • There is little relationship between how soon they took the course and success • Partly due to lack of variability in time to take • Variations in success rates in the later 4 semesters are due to very small numbers in those semesters (outliers)
Math: How many never take? • Students who place in lower levels of math are more likely to never take a math course even when assessed • Students who do not assess in expected pattern are unlikely to ever take a math course
English: How many never take? • Students who place in lower levels of Eng are more likely to never take an Eng course even when assessed • Students who do not assess in expected pattern are unlikely to even take an Eng course
Unpacking the Un-assessed • If Assessment becomes mandatory, capacity would need to increase. • But by how much? • Who would we “catch”? • Would assessment add to their educational outcomes?
Math: Unpacking the Un-assessed Methodology: Zoom in on 2005 cohort of “new” students who didn’t assess in the expected pattern (i.e., between 3/05 and 8/05).
Majority have an ed goal of BA or AA Many were previously enrolled as concurrent students (then became “new”) More females (58%) than males (42%) took the test before the expected window. 80% took a math class at some point at LPC 83% were stilled enrolled at LPC in the Fall of 2006 or beyond Math: Unpacking the Un-assessed: Who are the students who took the test before our expected test dates?
Math: Unpacking the Un-assessed: Who are the students who took the test after our expected test dates? • Majority have an ed goal of BA or AA • More males (58%) than females (42%) took the test after the expected window. • Of the students who took test after the expected window, 70% took a math class at some point at LPC • 83% were still enrolled at LPC in Fall 2006 or beyond
Math: Unpacking the Unassessed: Who are the students who never took the test (are truly unassessed)? • A mixed bag of ed goals: career/job, personal growth, certificates, and a few BA/AAs. • Slightly more females (53%) than males (47%) were never placed • 85% never take a math class • 42% were not enrolled at LPC after Fall 2005 • 58% were not enrolled at LPC after Spring 06 • 25% were enrolled solely or primarily in ESL and/or PE courses
Math: Unpacking the Un-assessed: A mixed bag of ed goals: career/job, personal growth, certificates, and BA/AAs. Slightly more females (53%) than males (47%) were never placed 85% never take a math class 42% were not enrolled at LPC after Fall 2005 58% were not enrolled at LPC after Spring 06 25% were enrolled solely or primarily in ESL and/or PE courses Who are the students who never took the test (are truly un-assessed)?
English: Unpacking the Un-assessed Zoom in on 2005 cohort of “new” students who didn’t assess in the expected pattern (i.e., between 3/05 and 8/05)
Majority have an ed goal of BA or AA Many were previously enrolled as concurrent students (then became “new”) As with math, more females (56%) than males (44%) took the test before the expected window. 82% took an English class at some point at LPC 80% were stilled enrolled at LPC in Fall 2006 or beyond English: Unpacking the Un-assessed: Who are the students who took the test before our expected test dates?
English: Unpacking the Un-assessed: Who are the students who took the test after our expected test dates? • Majority have an ed goal of BA or AA • As with math, more males (54%) than females (46%) took the test after the expected window. • 65% took an English class at some point at LPC • 85% were still enrolled at LPC in Fall 2006 or beyond
English: Unpacking the Un-assessed: Who are the students who never took the test (the truly un-assessed)? • A more mixed bag of ed goals than assessed students but majority are undecided/unknown or BA/AAs. • Slightly more females (53%) than males (47%) were never placed • 86% never take an English class • 41% were not enrolled at LPC after Fall 2005 • 54% were not enrolled at LPC after Spring 2006 • 22% were enrolled solely or primarily in ESL and/or PE courses
Unpacking the Un-assessed: A good portion would likely be exempted from mandatory assessment (Personal development, non –degree seeking) A good portion are ESL As a group they have lower enrollment and persistence (chicken and egg) Would the act of assessment cause these students to enroll and persist? Would other or additional interventions be needed? Who are the students who never took the test (the truly un-assessed)?
Math: Potential vs Actual Enrollment New and continuing students in Fall 2008 who potentially could enroll (i.e., took pre-reqs or were placed) in 107, 65 or 55 versus actual enrollment numbers.
Math: Potential vs Actual Enrollment • This analysis has many limitations • While the difference between “need” and “seats” is high for Math 107, given the fill rate and the fact that un-assessed do not take math, it’s not likely that more math 107 seats are needed • With Math 55/65 the “need to seats” ration is smaller the high fills rates suggest more courses could be offered • Knowing what we know about the “un-assessed” what affect would mandatory assessment have on math demand?
English: Potential vs Actual Enrollment New and continuing students in Fall 2008 who potentially could enroll (i.e., took pre-reqs or were placed into it) 100/104 or 1A versus actual enrollment numbers.
English: Potential vs Actual Enrollment This analysis has many limitations Data suggests that current “need” is beyond our capacity to accommodate Knowing what we know about the “un-assessed” what affect would mandatory assessment have on Eng demand? Can we accommodate any increased demand?
Research on Math and English Placement Trends and Subsequent Course Enrollment • What surprised you? • What did you already know? • What more would you need to know? • What operational and logistic considerations do we need to examine? • What concerns do you have?
Research on Math and English Placement Trends and Subsequent Course Enrollment • At least 14 people attended this meeting (faculty, classified and administrators)
Research on Math and English Placement Trends and Subsequent Course Enrollment • Data Needs: • On the “who could take” analysis • Make sure we included 107x/y in actual enrollments • Double check to see if enrollments are total enrollments or just degree seeking • Does this include W/F’s? If not please add • *Slides 34 and 36 now contain these changes
Research on Math and English Placement Trends and Subsequent Course Enrollment • Data Needs: • Would like to see analysis on Repeaters and their success in Eng and Math • Need to add in Fall 2009 placement data when 09 file is ready • Need to run data on Orientation. # who take it and # of new students who do not. Then compare it to our capacity. Need to do some more fact finding about orientation to complete impact report
Research on Math and English Placement Trends and Subsequent Course Enrollment • Other data the group would like to see at some point but is not front burner • Math/Eng course sequencing data • Repeater Analysis • Success Rates • Course Combo data (Eng and Math with GE courses)
Research on Math and English Placement Trends and Subsequent Course Enrollment • Results of Dialogue • Data shows that we are doing a good job at placing most students • Mandated assessment does not appear that it would increase demand or strain capacity of the assessment center • Data shows that most students do attempt Eng/Math in first one or two semesters
Research on Math and English Placement Trends and Subsequent Course Enrollment • Results of Dialogue • The additional students we would “catch” with mandatory assessment would likely start at the bottom of the sequences • The academic progress of these students is not likely to be improved with mandatory placement. • If we did place more students and push to have them take Eng/Math sooner we would increase our capacity issues for those courses. Math and Eng basic skills courses have very high fill rates.
Research on Math and English Placement Trends and Subsequent Course Enrollment • Efficacy of the test and Placement was a major area of concern
Research on Math and English Placement Trends and Subsequent Course Enrollment • Efficacy of the test and Placement • Transparency to students • Students don’t understand what they are doing when they assess • We could do a better job at prepping students for their assessment tests. • Ideas to improve transparency include: an assessment website with an explanation of the test, it’s importance, sample questions, FAQ’s
Research on Math and English Placement Trends and Subsequent Course Enrollment • Efficacy of the test and Placement • Does the test really place for our curriculum? • There was dialogue about the Accuplacer test and out curriculum as well as lack of alignment of high school curriculum and college curriculum (mainly in Eng) • We have a reading test but the curriculum is writing • It was also noted that some students who would be better placed into ESL are sometimes placed into ENG 100A/104 (Generation 1.5)
Research on Math and English Placement Trends and Subsequent Course Enrollment • ESL and LRNS (Learning Skills) • Dialogue focused on the efficacy of placement for students who are recommended to take the ESL or LRNS tests • The test might not identify these students. • If assessment is made mandatory these are likely the additional students we would “catch”. • If we have more of these students do we have the capacity and curriculum, programs, services for them?