Download
1 / 34
340 likes | 423 Vues
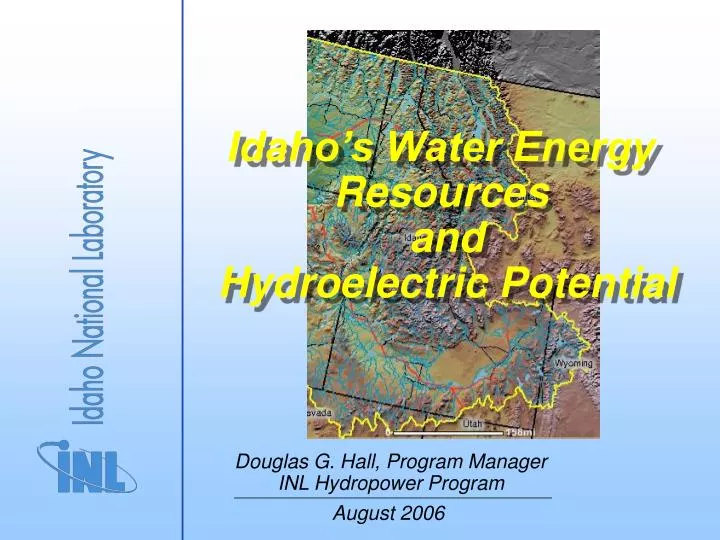
Idaho’s Water Energy Resources and Hydroelectric Potential. Douglas G. Hall, Program Manager INL Hydropower Program. August 2006. Topics. Idaho electricity state of the state Energy sources, production, and consumption Hydroelectric plants and generation

E N D
Idaho’s Water Energy Resources and Hydroelectric Potential Douglas G. Hall, Program Manager INL Hydropower Program August 2006
Topics • Idaho electricity state of the state • Energy sources, production, and consumption • Hydroelectric plants and generation • Basic natural stream resource assessment • Resource spatial distribution • Resource gross power potential • Feasibility assessment • Feasible potential projects • Project realistic power potential • Development opportunities & costs • Virtual Hydropower Prospector – a GIS application • Water energy resource site & feasible project locator • Preliminary feasibility assessment tool
Idaho Electricity State of the State
Idaho Electricity State of the State • Electricity consumption*: 21 billion kilowatthours • Electricity production*: 10 billion kilowatthours • Electricity Sources*: • Trends by source*: (1993-2002) • Average 2004 retail price** of electricity: 5¢/kWh • (2nd lowest in the nation) * EIA, State Energy Profiles 2002 ** EIA, Electric Power Annual 2004
136 Plants 2,468 MW Idaho Hydroelectric Plants • Hydroelectric plants: 136 • Total plant capacity: 2,468 MW • Total annual average power: 1,300 MWa • Average annual generation: 11 billion kilowatthours • Plant ownership: • Capacity ownership:
61 hydroelectric plants within 50 mi. of Twin Falls, ID Milner: 59 MW Birch Ck: 30 kW
Hydropower 101 Capacity – the maximum plant power rating (MW) Annual Average Power – average rate at which electricity is generated during a year (MWa) Power ≈ hydraulic head x water flow rate Generation (MWh) =capacity factor x capacity x 8760hrs OR Generation (MWh) =annual average power x 8760hrs Typical capacity factor = 0.5
“Available” Gross Power Potential 10,000 MWa Feasible Gross Power Potential 7,000 MWa Feasible Hydropower Potential 2,000 MWa State gross power potential to feasible hydropower potential Total Gross Power Potential 19,000 MWa Excluded power & Developed power subtracted Feasibility Criteria applied Development Criteria applied
Assessment methodology • Power potential of every stream reach in the state estimated • Reach hydraulic heads (elevation difference start to finish) provided by digital elevation models • Reach annual mean flow rates estimated using regression equations based on stream gages • Combination of reach hydraulic head and flow rate yields gross power potential • Zones where development unlikely identified using GIS • Federal exclusion zones • Environmental exclusion zones • Developed reaches identified by matching existing plants and reaches using GIS
Gross power potential by state and power category 4th in the Nation Idaho 19,000 MWa
Feasibility criteria • Not previously developed • Development not improbable • Not in federal exclusion zone • Not in environmental exclusion zone • Site assessibility – within 1 mile of a road • Load or tranmission proximity • Within 1 mile of either OR • Power line • Substation • Power plant Within the 90th percentile of distances of hydro plants in the same power class to a city or populated area boundary in the hydrologic region
Site development configurations Artist’s Conception of Canal Offtake Project Tazimina Project Alaska
Environmental benefits & desirable features • Emissions-free generation • Power predicability • New dam not required • Reservoir is not created • Main stream channel is not obstructed • Small plant footprint • Minimal visual impact • Long plant life (30 to 50yrs or more)
Project development criteria • Working stream flow – the lesser of: • Half the reach flow rate OR • Sufficient flow rate to produce 30 MW • Working hydraulic head – penstock length • Upper limit set by existing projects • Search algorithm found optimal location for minimum length penstock to capture maximum hydraulic head
Feasible hydropower potential by state and power category 4th in the Nation Idaho 2,122 MWa
Idaho potential projects by power & technology classes • Feasible projects having hydropower potential ≥ 10 kW 6,700 potential projects Feasible hydropower potential: 2,000 MWa Small hydro: >1 MW & 30 MW Low power: < 1 MW
Annual Hydroelectric Generation w/ New Low Power & Small Hydro 30 x 109 kWh Annual Hydroelectric Generation w/ New Small Hydro 24 x 109 kWh Idaho Annual Consumption 21 x 109 kWh Current Annual Hydroelectric Generation 11 x 109 kWh Idaho hydroelectric growth potential from new low power and small hydro plants Potential Low Power 607 MWa Potential Small Hydro 1,515 MWa Current Total Average Power 1,300 MWa
260 Potential Powerhouse Additions 396 Dams 136 Hydroeletric Plants = – Powerhouse additions to existing dams – possibly low hanging fruit • Minimal additional environmental impact • Less time and cost to license • Lower unit development cost ($/kW)
Estimated development costs for three types of capacity increase opportunities • INL developed cost estimating tools based on historical cost data • Cost estimating tools applied to Idaho capacity increase opportunties > 1 MW assessed in 1990’s
Unassessed More Idaho water energy resources • Natural stream locations for hydrokinetic technologies • Constructed waterways – canals & aquaducts • Municipal water supply systems • Effluent streams • Water treatment plants • Power plants • Industrial plants
Virtual Hydropower Prospector • Geographic Information System (GIS) tool on the Internet • Idaho National Laboratory developed and served (http://hydropower.inl.gov/prospector/) • No special software or licenses required to use • Displays 500,000 water energy resource sites and 130,000 feasible project sites throughout the U.S. • Displays context features needed to perform preliminary feasibility assessments • Provides tools for locating and selecting features of interest • Goes beyond geographic location and provides attribute informationabout selected features
Water energy features Water energy resource sites (500,000 sites) Feasible potential projects (130,000 sites) Hydrography (5 feature sets) Power system Hydro plants Other plants Power lines Substations Transporation Roads Railroads Areas & places Cities Populated areas County boundaries State boundaries Hydrologic region boundaries Land Use Excluded areas Federally designated Environmentally sensitive Bureau of Indian Affairs (BIA) Bureau of Land Management (BLM) Bureau of Reclamation (BOR) Department of Defense (DOD) U.S. Forest Service (FS) U.S. Fish & Wildlife Service (FWS) U.S. National Park Service (NP) Features displayed
Conclusions • Idaho has a historyof hydroelectric generation which now allows it to enjoy the among the lowest electricity rates in the country • Over 50% of the Idaho’s water energy resources have not been developed and are not in development exclusion zones • Idaho could significantly increase hydroelectric generationusing undeveloped sites, existing dams, equipment upgrades, non-traditional resources, and new technology • Costs of new hydroelectric plants are competitiveconsidering environmental benefits, attractive features, and long life • Virtual Hydropower Prospectorprovides all hydropower stakeholders with a tool to evaluate new hydropower development
Access to references and VHP • Access: http://hydropower.inl.gov/ • References: (Resource Assessment link) • Feasibility Assessment of the Water Energy Resources of the United States for New Low Power and Small Hydro Classes of Hydroelectric Plants, DOE-ID-11263, January 2006. • Water Energy Resources of the United States with Emphasis on Low Head/Low Power Resources, DOE/ID-11111, April 2004. • Estimation of Economic Parameters of U.S. Hydroelectric Resources, INEEL/EXT-03-00662, June 2003. • U.S. Hydropower Resource Assessment Final Report, DOE/ID-10430.2, December 1998. • VHP: Virtual Hydropower Prospector link
Contact Douglas G. Hall, Program Manager INL Hydropower Program Idaho National Laboratory 2525 Fremont Ave. Idaho Falls, ID 83415-3830 Telephone: 208-526-9525 Email: douglas.hall@inl.gov