Emerging Opportunities in Commodity Market
420 likes | 707 Vues
Emerging Opportunities in Commodity Market. IT’S ALL ABOUT MONEY, HONEY!. Today’s Topics. Introduction about trading Introduction about Technical Analysis. WELCOMES YOU WISH YOU ALL PROFIT Through Technical Analysis. What is Trading ????. Buy and Sell is Trading!!!

Emerging Opportunities in Commodity Market
E N D
Presentation Transcript
Emerging Opportunities in Commodity Market IT’S ALL ABOUT MONEY, HONEY!
Today’s Topics • Introduction about trading • Introduction about Technical Analysis
WELCOMES YOU WISH YOU ALL PROFIT Through Technical Analysis
What is Trading ???? • Buy and Sell is Trading!!! • BuySell = Profit (or) Loss
Difference Physical TradingOnline Trading • Handling Risk No Handling Risk • 100% investment 5 - 10 % Investment • Single way Profit Two way profit • Trader based settlement MTM settlement
Online Trading Concepts BUY SELL HS LB LB HS Buy Profit Sell Profit
HS Rs.25 HS Sell Profit Buy Profit Rs.20 LB Rs.20 LB IT’S ALL ABOUT MONEY, HONEY!
Example for Rice Physical Trading Rs.10,00,000 Investment : Rice Qty : 50 MT Buy Rate = Rs. 20, Sell Rate = Rs. 25, Profit = Rs. 5 Profit = Rs. 2,50,000, Exp = Rs. 50,000, Net Profit = Rs. 2,00,000 Rice S / D Dec / Jan Jul / Aug Rs.20 Rs.5 Rs.25
Example for Rice Online Trading Rs.1,00,000 Investment : Rice Qty : 50 MT Buy Rate = Rs. 20, Sell Rate = Rs. 25, Profit = Rs. 5 Profit = Rs. 2,50,000, Exp = Rs. 1,500, Net Profit = Rs. 2,48,500 Rice S / D Dec / Jan Jul / Aug Rs.20 Rs.5 Rs.25
Different Types of Market Spot Market - Real Market Future Market - Contract Basis Forward Market IT’S ALL ABOUT MONEY, HONEY!
Online Trading – Future Market Share Trading ( NSE & BSE ) - SEBI Commodities Trading ( MCX & NCDEX ) - FMC IT’S ALL ABOUT MONEY, HONEY!
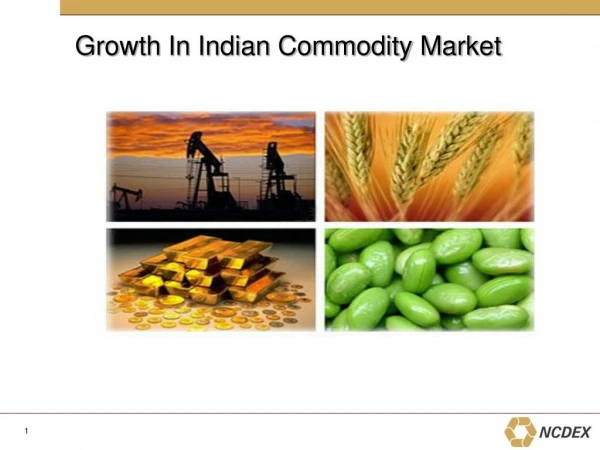
Products Agro Commodities Metals Precious Metals Energy
Commodity Market Timing Market Timing : 10 A.M to 5 P.M - ( Indian Commodities ) 10 A.M to 11.55 P.M - ( International Commodities ) Market Driven by Demand and Supply IT’S ALL ABOUT MONEY, HONEY!
ONLINE TRADING Commodities Trading Share Trading • Market Driven by Demand and Supply
Example for Demand and Supply Example :- Gold S / D Dec / Jan Jul / Aug Rs.1600 Rs.100 Rs.1700
How to Find Demand and Supply? Demand and Supply Fundamentals Technical Analysis Symptoms Human Psychology
How to do Online Trading? • We have to predict Demand & Supply • 75% Home Work • 25% Investment.
How To Do Online Trading? What is Home Work? • Fundamentals • Technical Analysis • Market Knowledge
Technical Analysis Trend ( Up or Down ) Target (Support / Resistance) Timing
Trend • Up trend, Down Trend, Neutral Trend • Doesn’t necessary be a smooth line
Technical Analysis Chart Patterns Chart Analysis Tool Analysis
Chart Patterns • There are two types of Chart patterns • Trend Reversal • Trend Continuous
Trend Reversal Chart Patterns Double Top Pattern Triple Top Pattern Head and Shoulders Inverted Head and Shoulders Double Bottom Pattern Triple Bottom Pattern
Chart Analysis • There are mainly three types of chart, which is popular amongst analyst. 1. Line Chart2.Candle Stick3.Bar Chart
Charts- Line Chart • Aline chart is simply a graph of the value of a currency taken at regular time intervals based on current prices.
Charts- Candlestick • Started in Japan in 1700s for rice trade • There’s a link between price and supply & demand of rice BUT there’s also the emotions of traders. • The candlestick chart analysis measures the market emotions.
Major Candlestick Signals DARK CLOUD EVENING STAR ENGULFING HARAMI DOJI MORNING STAR HAMMERS & HANGING-MAN PIERCING HARAMI ENGULFING
Tool Analysis • Tool analysis indicating signals for Buy & Sell • There are more than 200 tools available in Tool analysis • Tool analysis indicating signals based on Price & Volumes • Here we are considering only 3 major tools Stochastic Oscillator Moving Average Parabolic
Moving Averages (MA) • What’s MA? • It smooth out price data and observe the general direction of movement for a stock. • Types of MA: • 10-day, 20-day, 50-day, 100-day, 200-day • Function: 1.Signal to Buy/Sell 2.Support
MA – Signal to Buy Key: Crossover & Movement • ST: 10-day MA crosses 20-dayMA Moving Upwards Signal to Buy
MA – Signal to Sell • ST: 10-day MA crosses 20-day MA Moving Downwards Signal to Sell
Oscillators • Oscillators are indicating the market condition, Like overbought and oversold • Be careful: it might just be the beginning of the trend, only use it in trading in neutral market • Examples of oscillators used: -Relative Strength Index (RSI) -Moving Average Convergence Divergence (MACD) -Stochastic etc.
Stochastic Theory: In an uptrend market, closing prices tend to be near the highs In a downtrend market, closing prices tend to be near the lows %K line and %D line %K = 100[(C - L14)/(H14 - L14)] C = current closing price L14 = lowest low price during 14-day period H14 = highest high during 14-day period %D = %K smoothed over three days
Implementing Technical Analysis for Trading • Before taking Position we have to Desire 4 things… • Entry levels • Targets • Stop Loss • Timing • Role of Discipline, Risk/Money Management in trading
Conclusion • When to use technical analysis: • • looking for short-term • • Indicators are only indicators • When fundamental analysis is more appropriate • • Long-term • Or combine both