Download

1 / 14
140 likes | 373 Vues
Genome-wide association studies. BNFO 602 Roshan. Application of SNPs: association with disease. Experimental design to detect cancer associated SNPs: Pick random humans with and without cancer (say breast cancer) Perform SNP genotyping Look for associated SNPs

E N D
Genome-wide association studies BNFO 602 Roshan
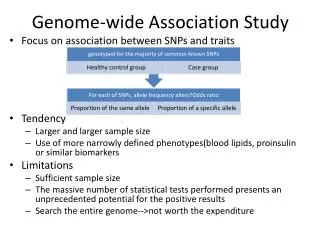
Application of SNPs: association with disease • Experimental design to detect cancer associated SNPs: • Pick random humans with and without cancer (say breast cancer) • Perform SNP genotyping • Look for associated SNPs • Also called genome-wide association study
Study of 100 people: Case: 50 subjects with cancer Control: 50 subjects without cancer Count number of alleles and form a contingency table Case-control example
Odds of allele 1 in cancer = a/b = e Odds of allele 1 in healthy = c/d = f Odds ratio of recessive in cancer vs healthy = e/f Odds ratio
Odds of allele 1 in case = 15/35 Odds of allele 1 in control = 2/48 Odds ratio of allele 1 in case vs control = (15/35)/(2/48) = 10.3 Example
Statistical test of association (P-values) • P-value = probability of the observed data (or worse) under the null hypothesis • Example: • Suppose we are given a series of coin-tosses • We feel that a biased coin produced the tosses • We can ask the following question: what is the probability that a fair coin produced the tosses? • If this probability is very small then we can say there is a small chance that a fair coin produced the observed tosses. • In this example the null hypothesis is the fair coin and the alternative hypothesis is the biased coin
Binomial distribution • Bernoulli random variable: • Two outcomes: success of failure • Example: coin toss • Binomial random variable: • Number of successes in a series of independent Bernoulli trials • Example: • Probability of heads=0.5 • Given four coin tosses what is the probability of three heads? • Possible outcomes: HHHT, HHTH HTHH, HHHT • Each outcome has probability = 0.5^4 • Total probability = 4 * 0.5^4
Binomial distribution • Bernoulli trial probability of success=p, probability of failure = 1-p • Given n independent Bernoulli trials what is the probability of k successes? • Binomial applet: http://www.stat.tamu.edu/~west/applets/binomialdemo.html
Hypothesis testing under Binomial hypothesis • Null hypothesis: fair coin (probability of heads = probability of tails = 0.5) • Data: HHHHTHTHHHHHHHTHTHTH • P-value under null hypothesis = probability that #heads >= 15 • This probability is 0.021 • Since it is below 0.05 we can reject the null hypothesis
We have two random variables: X: disease status A: allele type. Null hypothesis: the two variables are independent of each other (unrelated) Under independence P(X=case and A=1)= P(X=case)P(A=1) Expected number of cases with allele 1 is P(X=case)P(A=1)N where N is total observations P(X=case)=(a+b)/N P(A=1)=(a+c)/N What is expected number of controls with allele 2? Do the probabilities sum to 1? Null hypothesis for case control contingency table
Chi-square statistic Oi = observed frequency for ith outcome Ei = expected frequency for ith outcome n = total outcomes The probability distribution of this statistic is given by the chi-square distribution with n-1 degrees of freedom. Proof can be found at http://ocw.mit.edu/NR/rdonlyres/Mathematics/18-443Fall2003/4226DF27-A1D0-4BB8-939A-B2A4167B5480/0/lec23.pdf
Chi-square • Using chi-square we can test how well do observed values fit expected values computed under the independence hypothesis • We can also test for the data under multinomial or multivariate normal distribution with probabilities given by the independence assumption. This would require cumulative distribution functions of multinomial and multi-variate normal which are hard to compute. • Chi-square p-values are easier to compute
Case control E1: expected cases with allele 1 E2: expected cases with allele 2 E3: expected controls with allele 1 E4: expected controls with allele 2 N = a + b + c + d E1 = ((a+b)/N)((a+c)/N) N = (a+b)(a+c)/N E2 = (a+b)(b+d)/N E3 = (c+d)(a+c)/N E4 = (c+d)(b+d)/N Now compute chi-square statistic
Chi-square statistic • Compute expected values • and chi-square statistic • Compute chi-square • p-value by referring to • chi-square distribution