Hashing Scheme Visualization
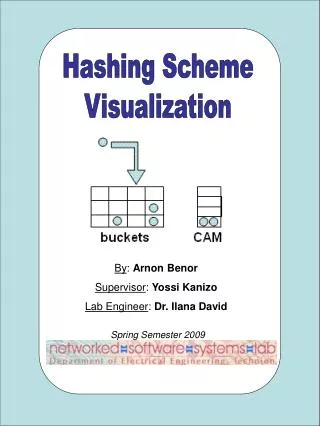
Hashing Scheme Visualization. By : Arnon Benor Supervisor : Yossi Kanizo Lab Engineer : Dr. Ilana David. Spring Semester 2009. Motivation.

Hashing Scheme Visualization
E N D
Presentation Transcript
Hashing Scheme Visualization By: Arnon Benor Supervisor: Yossi Kanizo Lab Engineer: Dr. Ilana David Spring Semester 2009
Motivation • Network switches transfer packets between several sources and destinations (computers or other network devices). This is done at MAC level, IP level, or sometimes even higher up the hierarchy (application, etc.) • Network switches are required to efficiently handle huge amounts of traffic and fast: • Switches are connected to tens/hundreds of ports, transferring tens of millions of packets per second (several Gbps!) • Time slots and memory accesses are performed in nanoseconds • Power usage: 100's of Watts (can reach 1 MWhr and more!) • "Heavy hitters" (spam, virus, etc.) may disproportionately send out large amounts of traffic. Good network managers must perform statistics on network (switch) traffic, identify (and even block) misusers, to ensure network stability and fairness • An efficient way to set up these "elephant traps" is by using hash-like structures and schemes. However, hash functions suffer collisions. Good hashing functions and schemes are required to minimize memory usage and accesses, whilst effectively and accurately identifying network flows
Motivation (cont’d) • However, determining the most appropriate hashing schemes, and tuning their parameters properly is not at all trivial. • Besides theoretical analysis of such schemes, visualizations and simulations are required to correctly understand, teach, and research their algorithmic behavior. Project Objective • Create an easily extendible infrastructure on which various hashing schemes may be implemented, configured, and visualized (and possibly simulated). • In addition, as proof of concept and for practical uses, a few specific hashing schemes are to be implemented using the programmed infrastructure: Simple, Greedy, MHT, and 2nd Choice hashing schemes. • The visualization should be accessible via web browser; recommended implementation as Java Applet.
Project Design Class Diagram (of main classes and relationships): • HSMainApplet – Opens interactive configuration screen; user selects hashing scheme and parms. When done, inits BasicHash with config, handing over "graphical pen" to HSAppletVisualizer • HSAppletVisualizer – Draws and animates; pulls info from BasicHash and responds to event calls received from BasicHash • BasicHash – Hash structure and service methods. Abstract insertElement() method. Class contains entire hashing scheme run framework, using HSVisualizable as drawing service • BasicHash derivatives – Family of classes extending BasicHash; implement element insertion algorithm – heart of hashing scheme
Configuration Screen • The applet configuration screen is where the user may select the scheme he/she wishes to visualize, and also set the visualization parameters • When done configuring, “VISUALIZE” button is pressed
Visualization Screen • The visualization screen is in charge of displaying the insertion algorithms (aka schemes) step by step, using the controls at the top • The display contains informative messages above, current hash statistics at the top right, and current hash drawing & graphical animation at the bottom • Visualization provides a good way to understand and teach various hashing algorithms, and to analyze their behavior