Download
1 / 55
560 likes | 749 Vues
First MINOS Results from the NuMI Beam. Marvin L. Marshak University of Minnesota for the MINOS collaboration. SLAC, May 16, 2006. Overview. Introduction to the MINOS experiment Overview of MINOS Physics Goals The NuMI facility and the MINOS detectors

E N D
First MINOS Results from the NuMI Beam Marvin L. Marshak University of Minnesota for theMINOS collaboration SLAC, May 16, 2006
Overview Introduction to the MINOS experiment Overview of MINOS Physics Goals The NuMI facility and the MINOS detectors Near Detector and beam measurements Selecting cc muon neutrino events Near detector distributions and comparison with Monte Carlo Far detector analysis Selecting Beam neutrino candidates Near-Far extrapolation of the neutrino flux Oscillation Analysis with 0.931020 POT
735 km The MINOS Experiment • MINOS (Main Injector Neutrino Oscillation Search) • a long-baseline neutrino oscillation experiment: • Neutrino beam provided by 120 GeV protons from the Fermilab Main Injector. • Near Detector at Fermilab to measure the beam composition and energy spectrum • Far Detector deep underground in the Soudan Mine, Minnesota, to search for evidence of oscillations (12 km)
The MINOS Collaboration Argonne • Athens • Benedictine • Brookhaven • Caltech • Cambridge • Campinas College de France • Fermilab • Harvard • IIT • Indiana • ITEP-Moscow • Lebedev • Livermore Minnesota-Duluth • Minnesota-Twin Cities • Oxford • Pittsburgh • Protvino • Rutherford Sao Paulo • South Carolina • Stanford • Sussex • Texas A&M • Texas-Austin Tufts • UCL • Western Washington • William & Mary • Wisconsin
MINOS Physics Goals • Verify mixing hypothesis and make a precise (<10%) measurement of the oscillation parameters m2 and sin2 2 • Search for sub-dominant e oscillations • Rule out exotic phenomena (e.g. neutrino decay) • Use magnetized MINOS Far Detector to study neutrino and anti-neutrino oscillations • Test of CPT violation • Atmospheric neutrino oscillations • First MINOS paper: hep-ex/0512036, forthcoming in Phys. Rev D
Current knowledge of atmospheric neutrino oscillations Current best measurements of Δm2 and sin22θ fromSuper-Kamiokande (atmospheric neutrinos) andK2K (0.9 x 10²⁰ POT) The limits (at 90% C.L.) are: • sin22θ > 0.9 • (1.9 < Δm2 < 3.0) 10-3 eV2 MINOS analysis is for 0.93 1020 POT, and should provide a competitive measurement of the mixing parameters Allowed regions from Super-K and K2K
MINOS Methodology Look for a deficit of νμ events at Soudan νμ spectrum Spectrum ratio Monte Carlo Monte Carlo Unoscillated Oscillated
Overview of the Oscillation Measurement • To perform the oscillation analysis, we need to predict the neutrino spectrum seen by the Far Detector in the absence of oscillations. • Want to minimize uncertainties related to beam modeling and cross-sections (nominal values are built-in to our Monte Carlo.) • Use the Near Detector data to correct the nominal Monte Carlo • beam spectrum • neutrino cross-sections
The NUMI facility • Design parameters: • 120 GeV protons from the Main Injector • Main Injector can accept up to 6 Booster batches/cycle, • Either 5 or 6 batches for NuMI • 1.867 second cycle time • 4 x 10¹³ protons/pulse • 0.4 MW • Single turn extraction (~10ms)
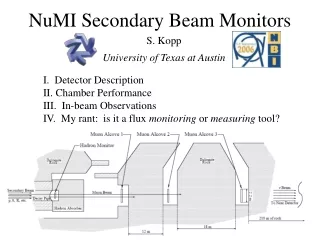
The NuMI beamline Primary proton line Decay pipe Target hall
Producing the neutrino beam • Single turn extraction • ~10 μs spill of 120 GeV protons every ~2 s • 0.25 MW average beam power • 2.5 1013 protons per pulse (ppp)
The NuMI neutrino beam • Currently running in the LE-10 configuration • ~1.5 1019 POT in pME and pHE configurations early in the run for commissioning and systematics studies LE pME pHE Events expected in fiducial volume
First Year of Running 1020 pot! Observation of neutrinos in Near Detector! Start of LE running Dataset used for the oscillation analysis
The MINOS Detectors Veto Shield Far Near Plane installation fully completed on Aug 11, 2004 Coil Detectors magnetised to 1.2 TGPS time-stamping to synch FD data to ND/Beam Flexible software triggering in DAQ PCs: FD triggers from FNAL over IP 5.4 kt mass, 8830m 484 steel/scintillator planes Divided into 2 super modules M16 multi-anode PMTs, VA chips 1 kt mass, 3.84.815m282 steel and 153 scintillator plane Front 120 planes Calorimeter Remaining planes Spectrometer M64 multi-anode PMTs, QIE chips
MINOS Near and Far Detectors are functionally identical: 2.54 cm thick magnetized steel plates co-extruded scintillator strips orthogonal orientation on alternate planes – U,V optical fibre readout to multi-anode PMTs Detector Technology Scintillator strip M16 M64
Event topologies Monte Carlo νμ CC Event νeCC Event NC Event UZ VZ 3.5m 1.8m 2.3m long μ track & hadronic activity at vertex short event, often diffuse short, with typical EM shower profile Eμ = Eshower + pμ 55%/E/GeV 6% range, 10% curvature
nm CC-like events are selected in the following way: Event must contain at least one good reconstructed track The reconstructed track vertex should be within the fiducial volume of the detector: The fitted track should have negative charge (selects nm) [for now] Cut on likelihood-based Particle ID parameter which is used to separate CC and NC events. Event selection cuts NEAR:1m < z < 5m (from detector front),R < 1m from beam centre. FAR:z > 50 cm from front face, z > 2 m from rear face, z not in supermodule gap, R2 < 14 m2 from detector center. Calorimeter Spectrometer ν
The MINOS Calibration Detector • Help understand energy response to reconstruct Eν • Eν = pµ + Ehad • Measured in a CERN test beam with a “mini-Minos” • operated in both Near and Far configurations • Study e/µ/hadron response of detector • Test MC simulation of low energy interactions • Provides absolute energy scale for calibration beam Single particle energy resolution
MINOS Calibration system • Calibration of ND and FD response using: • Light Injection system (PMT gain) • Cosmic ray muons (strip to strip and detector to detector) • Calibration detector (overall energy scale) • Energy scale calibration: • 1.9% absolute error in ND • 3.5% absolute error in FD • 3% relative
Selecting CC events Events selected by likelihood-based procedure, with 3 input Probability Density Functions (PDFs) • event length in planes • fraction of event pulse height in the reconstructed track • average track pulse height per plane Define Pμ (PNC) as the product of the three CC (NC) PDFs, at the values of these variables taken by the event Input variables for PDF based event selection Monte Carlo
CC selection efficiencies • Particle ID (PID) parameter is defined: • CC-like events are defined by PID > −0.2 in the FD (> −0.1 in the ND) • NC contamination limited to low energy bins (below 1.5 GeV) • Selection efficiency is quite flat as a function of visible energy PDF PID parameter distribution PDF PID parameter distribution MonteCarlo (87%) CC-like (97%)
Near Detector distributions • We observe very large event rates in the Near detector (~107 events in the fiducial volume for 1020 POT) • This provides a high statistics dataset with which we can study how well we understand the performance of the Near Detector and check the level to which our data agrees with our Monte Carlo predictions Reconstructed track angle with respect to vertical Distribution of reconstructed event vertices in the x-y plane Beam points down 3 degrees to reach Soudan Reconstructed y vertex (m) Fiducial region Coil hole Partially instrumented planes Detector outline Area normalised Reconstructed x vertex (m)
Particle ID variables (LE-10 Beam) Event length Track PH per plane Calorimeter/ spectrometer boundary Track PH fraction
PID parameter LE-10 pME PID cut to select CC-like events is at –0.1 pHE
Shower profiles – LE-10 beam • Overall agreement between data and MC • Data showers tend to be slightly shorter and more “dense” than MC showers
Energy spectra & Y (CC-like events) Reconstructed Neutrino Energy (GeV) pHE pME LE-10 Reconstructed Y =Eshw/(Eshw+Em) pHE pME LE-10 These distributions shown after xF, pT reweighting
Hadron production tuning Agreement between data and Fluka05 Beam MC is mostly good, but by tuning the MC by fitting to hadronic xF and pT, improved agreement can be obtained. LE-10/185kA pME/200kA pHE/200kA LE-10/Horns off Weights applied as a function of hadronic xF and pT. LE-10 events Not used in the fit
Reconstructed energy distributions agree to within statistical uncertainties (~1-3%) Beam is very stable and there are no significant intensity dependent biases in event reconstruction. • June • July • August • September • October • November Stability of the energy spectrum & reconstruction with intensity Typical proton intensity ranges from 1013 ppp - 2.8times1013 ppp Energy spectrum by Month Energy spectrum by batch
Summary of ND Data/MC agreement • The agreement between low level quantities indicates that there are no obvious pathologies introduced by detector modeling and/or reconstruction. • Agreement between high level quantities is within the expected systematic uncertainties from cross-section modeling, beam modeling and calibration uncertainties (initial agreement improved after applying beam reweighting on the xF and pT of parent hadrons in the Monte Carlo)
Far Detector Beam Analysis Oscillation analysis performed using data taken in the LE-10 configuration from May 20th 2005 – December 6th 2005 • Total integrated POT: 0.931020 • Excluded periods of “bad data” – coil and HV trips, periods without accurate GPS timestamps. The effect of these cuts are small (~0.7% of our total POT) • POT-weighted live-time of the Far detector: 98.9%
Performing a blind analysis • The MINOS collaboration decided to pursue a blind analysis policy for the first accelerator neutrino results • The blinding procedure hides an unknown fraction of FarDet events based on their length and total energy deposition. • No blinding was applied to NearDet data • Unknown fraction of Far Detector data was open • performed extensive data quality checks. • Unblinding criteria were: • no problems with the FarDet beam dataset (missing events, reconstruction problems, etc.) • Oscillation analysis (cuts and fitting procedures) pre-defined and validated on MC; no re-tuning of cuts allowed after box opening
Selecting beam induced events • Time stamping of the neutrino events is provided by two GPS units (located at Near and Far detector sites). • FD Spill Trigger reads out 100μs of activity around beam spills • Far detector neutrino events easily separated from cosmic muons (0.5 Hz) using topology Time difference of neutrino interactions from beam spill Backgrounds estimated by applying selection algorithm on “fake” triggers taken in anti-coincidence with beam spills In 2.6 million “fake” triggers, 0 events survived the selection cuts (upper limit on background in open sample is 1.7 events at 90% C.L. ) Neutrino candidates are in 10μs window
p+ to Far Detector (stiff) target qf p+ qn (soft) Decay Pipe ND Predicting the unoscillated FD spectrum • Directly use Near Detector data to perform extrapolation between Near and Far • Use Monte Carlo to provide necessary corrections due to energy smearing and acceptance. • Use our knowledge of pion decay kinematics and the geometry of our beamline to predict the FD energy spectrum from the measured ND spectrum • This method is known as the Beam Matrix method.
Step A, Beam Matrix Method 1 Correction for purity Reconstructed =>True and Correction for efficiency 2
Beam Matrix Method : Near to Far extrapolation • Beam Matrix encapsulates the knowledge of pion 2-body decay kinematics & geometry. • Beam Matrix provides a very good representation of how the Far Detector spectrum relates to the near one.
Predicted true FD spectrum • higher than nominal FD MC in high energy tail • expected, given that the ND visible energy spectrum is also higher than the nominal MC in this region Predicted FD true spectrum from the Matrix Method 0.931020 POT Predicted spectrum Nominal MC
296 selected events with a track – no evidence of background contamination. Distribution of selected events consistent with neutrino interactions Vertex distributions of selected events Full dataset Area normalised
Track quantities & PID parameter Track Length Track Pulse Height per Plane Particle IdentificationParameter CC-like
Track angles Notice that beam is pointing 3 degrees up at Soudan! X Y Z
Physics distributions Muon Momentum (GeV/c) Shower Energy (GeV) y = Eshw/(Eshw+Pµ)
Numbers of observed and expected events • We observe a 33% deficit of events between 0 and 30 GeV with respect to the no oscillations expectation. • Numbers are consistent for nm+nm sample and for the nm-only sample • The statistical significance of this effect is 5 standard deviations
Data Best-fit Ratio of Data/MC
Systematic errors Systematic shifts in the fitted parameters have been computed with MC “fake data” samples for Δm2=0.003 eV2, sin22θ=0.9 for the following uncertainties:
In this talk we have presented the first accelerator neutrino oscillation results from a 0.931020 pot exposure of the MINOS far detector. Our result disfavors no disappearance at 5s and is consistent with n oscillations with the following parameters: The systematic uncertainties on this measurement are well under control and we should be able to make significant improvements in precision with a larger dataset. Our total exposure to date is 1.41020 pot. Summary and Conclusions