Sets and Functions
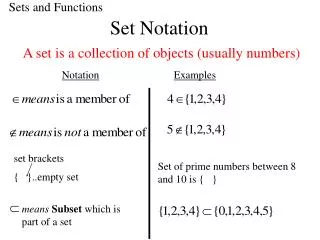
Set Notation. Sets and Functions. A set is a collection of objects (usually numbers). Notation. Examples. set brackets. Set of prime numbers between 8 and 10 is { }. { }..empty set. means Subset which is part of a set. Standard sets. The set of NATURAL NUMBERS.

Sets and Functions
E N D
Presentation Transcript
Set Notation Sets and Functions A set is a collection of objects (usually numbers) Notation Examples set brackets Set of prime numbers between 8 and 10 is { } { }..empty set meansSubset whichis part of a set
Standard sets The set of NATURAL NUMBERS The set of WHOLE NUMBERS The set of INTEGERS The set of RATIONAL NUMBERS Q...the set of all numbers which can be written as fractions, i.e. all of the above plus ½, -0.9….etc The set of REAL NUMBERS ...the set of all rational numbers plus irrationals e.g 2, pi etc.
R Q 0.5 Z -1,-2 W 0 N 5,6
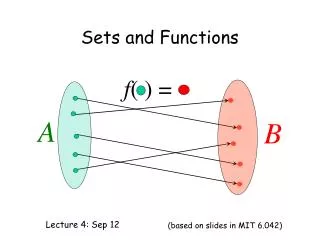
A • 1 • 2 • 3 • B • 3 • 7 • 9 Domain Range Functions and mappings. A function or mapping from a set A to a set B is a rule that relates each element in set A to ONE and only ONE element in set B. The set of elements in set A is called the DOMAIN The set of elements in set B is called the RANGE This is known as an arrow diagram.
A • 1 • 2 • 3 • B • 3 • 7 • 9 • A • 1 • 2 • 3 • B • 3 • 7 • 9 This is not a function or mapping as 2 is mapped to 7 and 9. This is a function as each element in set A is mapped to one and only one element in set B.
Graph Notation. Not a function A Function
A • -2 • -1 • 0 • 1 • 2 • B • 8 • 3 • 0 • -1 domain range • The function f, defined by f(x) = x² - 2x, has domain • {-2, -1, 0, 1, 2}. Find the range. 8 -2 2 f(x) = x² - 2x, f(-2) = (-2)² - 2(-2)= 8 f(-1) = (-1)² - 2(-1)= 3 f(0) = 0² - 2(0) = 0 f(1) = 1² - 2(1) = -1 f(2) = 2² - 2(2) = 0 Range is {-1, 0, 3 , 8} Arrow diagram Graph Formula
Composition of Functions h(x) = 4x - 3, can be thought of as a composition of two functions: Multiply by 4 and then subtract 3 f(x) = 4x g(x) = x - 3 • 4x - 3 • -7 • -3 • 1 • x • -1 • 0 • 1 • 4x • -4 • 0 • 4 h(x) = 4x - 3, h(x) is f applied first then g applied to the result. h is a function of a function and written h(x) = g(f(x)) and readasgoff of x
f(x) = 2x, g(x) = x + 3, evaluate: • a) f(g(0)) b) f(g(-5)) c) g(f(2)) d) g(f(-1)) a) f(g(0)) b) f(g(-5)) c) g(f(2)) d) g(f(-1)) g(0) = 0 + 3 g(-5) = -5 + 3 = -2 f(2) = 2(2) = 4 f(-1) = 2(-1) = -2 = 3 f(g(0)) = f(3) f(g(-5)) = f(-2) g(f(2)) = g(4) g(f(-1)) = g(-2) = 2(3) = 6 = 4 + 3 = 7 = -2 + 3 = 1 = 2(-2) = -4
In general f(g(x)) g(f(x)) • If f(x) = 2x, g(x) = x + 3, Find • (a) h(x) = g(f(x)) • (b) k(x) = f(g(x)) (b) k(x) = f(g(x)) (a) h(x) = g(f(x)) g(x) = x + 3 f(x) = 2x f(g(x)) = f(x + 3) g(f(x)) = g(2x) = 2(x + 3) = 2x + 3 k(x) = 2x + 6 h(x) = 2x + 3
The denominator of a function can never be zero as it will be undefined.
f maps Set A to set B and maps Set B to set A. Inverse Functions. The inverse function is a function which reverses or ‘undoes’ a function • A • B Is used to denote this function The sets must be in 1 - 1 correspondence for this function to exist. f -1(f(x)) = f ( f -1(x)) = x
Graphs of Inverse Functions The graph of an inverse function is found by reflecting the graph in the line y = x.
Graphs of Inverse Functions The graph of an inverse function is found by reflecting the graph in the line y = x.
Graphs of Inverse Functions The graph of an inverse function is found by reflecting the graph in the line y = x.
Exponential and Logarithmic Functions f (x) = ax , x ϵ R is called an exponential function to base a, a ϵ R, a ≠ 0 It is read “a to the x” loga x is the logarithmic function and is the inverse of the exponential function. It is read as “log to the base a of x” then if Hence, if
Exp and Log Graphs f(x) = axpasses through (0,1) and (1,a) f-1(x) = logaxpasses through (1,0) and (a,1)
Determine the equation of the graphs shown below. (i) (i) (2,25) (1,4) 1 1 using (2,25) using (1,4)
Graphs of Functions Standard Graphs you should know.
Let us consider: all points moved up by ‘a’ units if a is positive and down if a is negative. a a a a a
1. Describe the transformation of the following graphs. The graph has been moved down vertically 5 units.
Part of the graph of f (x) = x2 – 3x is shown below. • Determine the values of A, B and C. • Sketch the graph of y = f (x) +2 • State the coordinates of the images of A, B and C. A and C are the roots of the quadratic. y They occur when y = 0. x C A C(3,0) A(0,0) B x = 1.5 The turning point B is mid way between the roots. C(1.5, -2.25) = -2.25 When x = 1.5, y = 1.52 - 31.5
(ii) y C` A` x C A B` B C` (3,2) (iii) A` (0,2) B` (1.5, -0.25)
Now Consider y = f (x + a) and y = f (x - a) All points are moved left by ‘a’ units if a is positive and right if a is negative. y (Right if a is negative) y = f (x) a x y = f (x - a)
Now Consider y = f (x + a) and y = f (x - a) All points are moved left by ‘a’ units if a is positive and right if a is negative. y (Left if a is positive) y = f (x) a x y = f (x + a)
Now Consider y = -f (x) y y = f (x) x y = - f (x) Page 40 Exercise 3G The y coordinates become negative. The graph is reflected in the X axis
Now Consider y = f (-x) y y = f (x) x y = f (-x) The x coordinates become negative. The graph is reflected in the Y axis
y (3,9) 2 x Graphs of related exponential functions As we saw previously, the equation of an exponential function can be determined from 2 points on the graph. 1. Part of the graph y = a x + b is shown below. Find the values of a and b and hence the equation of the curve.
y (3,9) 2 x Using the point (0,2) Using the point (3,9)
Graphs of Logarithmic Functions (1,a) (0,1) (a,1) (1,0)
y (5,1) x 1 Using the point (5,1)