Download
1 / 28
280 likes | 528 Vues
Oklahoma Wind Power Initiative (OWPI) Tim Hughes (OU) Mark Shafer (OU) Troy Simonsen (OU) Jeremy Traurig (OU) Nick Mirskey (OU) Steve Stadler (OSU) Pete Earls (OSU). 38 cents. 40. 35. 30. 25. 20. Cents per kWh. 15. 10. 15. 10. 5. 8. 2.5- 3.5*. 6. 4. 0. '80. '80. '84. '84.

E N D
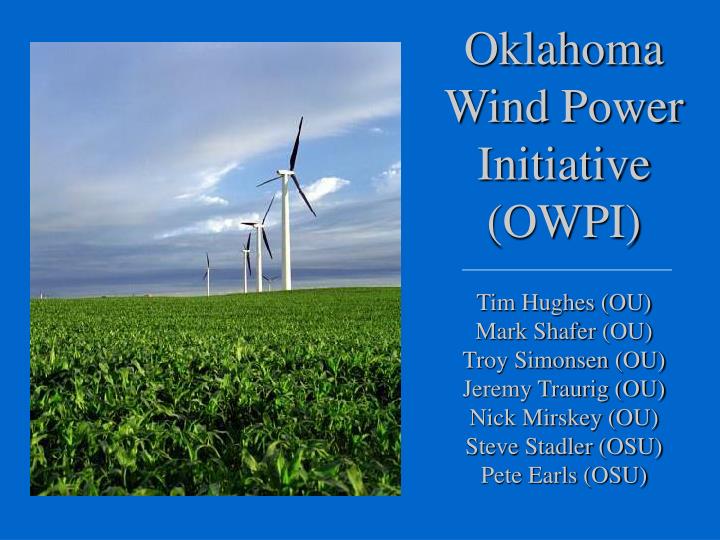
Oklahoma Wind PowerInitiative(OWPI)Tim Hughes (OU)Mark Shafer (OU) Troy Simonsen (OU)Jeremy Traurig (OU)Nick Mirskey (OU)Steve Stadler (OSU)Pete Earls (OSU)
38 cents 40 35 30 25 20 Cents per kWh 15 10 15 10 5 8 2.5- 3.5* 6 4 0 '80 '80 '84 '84 ‘85 '88 '88 '89 '89 '91 '91 '92 '92 '95 '95 '97 '97 ''00 ‘00 2005 2005 * Assumptions: Levelized cost at excellent wind sites, large project size, not including PTC (post 1994) Wind Energy: Cost of Wind-Generated Electricity 1980 to 2005 Levelized Cents/kWh
OWPI GOALS: • Resource Assessment • Policy Study • Outreach • Educational programs • Community meetings • Promote Economic Development
115 Active stations, spaced ~32 km 5-minute resolution data Standard Meteorological variables following WMO standards 10-meter wind speed and direction; scaled to 50-meters using: U/Ur = (Z/Zr)1/6 Rural sites; generally good fetch conditions 1994-2000 data used in study The Oklahoma Mesonet
Oklahoma Wind Resource Maps Purple = class 5 or better, blue = class 4, lt. blue = class 3
Review Mesonet site surroundings to qualify “fetch conditions” of site, using: aerial photos (DOQQs) vegetation (LU/LC) site panorama photos Assign subjective ratings of ‘poor’, ‘fair’, ‘good’ or ‘excellent’ Steps for Developing Models
NORMAN Air Photo (zoomed) 250 m NORM wind rose 500 m
Combine information from: Mesonet Station data (wind, pressure, temperature - 735,000 readings of each per station) DEM elevation data Vegetation data (roughness) Input into two different models: analytical model (Windmap) empirical model (using neural networks for non-linear relationship) Steps for Developing Models
WindMap Software (Analytical) INPUTS OUTPUTS W I N D M A P ArcView* Final Winds Map DEM Data Elevation Grid ArcView* Power Density Map LULC (GAP) Map Roughness Grid 10 Meter Winds Turbine Output Map *A GIS Software Package
Analytical model output MODELED LONG-TERM AVERAGE WIND POWER DENSITY 50 METERS (164 FT.) Above Ground Level OWPI DRAFT 9/2001
Correlate wind power values calculated at Mesonet sites, with neural network scheme, to: site elevations north and south terrain exposures north and south average roughness Get equations for wind power density as function of the above Fill in grid for whole state Neural Network (Empirical)
North Wedge 146deg 34deg 326deg 214deg South Wedge Average Wind energy rose using wind data from 78 stations with ‘good-excellent’ rating on fetch conditions Wind energy in N + S wedges = 89% of total Realizable energy from turbines: > 95% from N & S
Sample calculated WPDs and elevation, terrain exposure, and roughness averages + 57 more …….
Wind Power Map for Oklahoma (Empirical Model using Neural Networks)
Initial run underestimated wind power density at most Mesonet sites Linear regression of predicted vs. calculated wind power density yielded correction factor of 1.33 Better agreement with field data from validation site, but still under-estimates in Southeast Oklahoma Analytical Model Findings
Emphasizes ridge lines (areas of good exposure Low Roughness Good Terrain Exposure Compared to WindMap and Tower data, likely underestimates, especially in Southeast Oklahoma Empirical Model Findings
NREL Resource Maps Purple = class 5 or better, blue = class 4, lt. blue = class 3
Analytical Model OWPI DRAFT 9/2001
Wind Climatology Cheyenne Mesonet Site Station ID: CHEY Class 3 Site (January ’94 – December ’00) Average 10 m Wind Speed = 5.70 m/s (12.8 mph) Average 10 m Power Density = 189 W/m2
Cheyenne Wind Energy Rose
Oklahoma Wind Power Initiative www.seic.okstate.edu/owpai Contact Tim Hughes: thughes@ou.edu For information on OWPI: For information on OREC: • Oklahoma Renewable Energy Council • www.seic.okstate.edu/OREC