Download

1 / 18
180 likes | 422 Vues
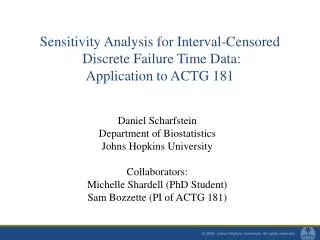
Statistical approaches to analyse interval-censored data in a confirmatory trial. Margareta Puu, AstraZeneca Mölndal 26 April 2006. Next 30 minutes. Summary of some of the methods available to analyse interval-censored data

E N D
Statistical approaches to analyse interval-censored data in a confirmatory trial Margareta Puu, AstraZeneca Mölndal 26 April 2006
Next 30 minutes • Summary of some of the methods available to analyse interval-censored data • Software that could be used for the analysis of interval-censored data • A simplified approach that could be used in some situations
What is interval-censored data? • The time of the event of interest is only known to have occurred within an interval of time • Common in clinical trials, where patients are seen at pre-scheduled visits but the event of interest occurs in between visits
Example: A breast cancer study • 94 patients randomised to two treatment groups: Radiation treatment and Combination treatment (Radiation treatment + Chemotherapy) • The purpose was to compare the two treatments with the respect to the time to cosmetic deterioration • Patients were supposed to be seen at pre-scheduled visits every 4 to 6 months, but follow-up intervals were often longer. A typically observation for a patient that have had an event is recorded as an interval such as (6, 14] months. Therefore, the event of interest is only known to have occurred between two visits.
Suggested analyses Consider the situation where data are interval-censored and individuals are randomised to two treatment groups. Suppose we would like to • Estimate and illustrate the survival distribution in each treatment group • Test the hypothesis whether there is a significant treatment effect or not by using a non-parametric test • Estimate the treatment effect and adjust the analysis for other covariates
If the intervals between consecutive visits are short Then we could approximate the interval-censored observation by e.g. the midpoint of the interval-censored observation. Then we would get exact failure time data rather than interval-censored data, and well-known statistical methods developed for right-censored data could be used for the suggested analyses.
A simplified approach (midpoint imputation) • Use the Kaplan-Meier (KM) estimator to estimate and illustrate the survival distribution in each of the two treatment groups • Use the log-rank test to test the hypothesis whether there is a significant treatment effect or not • Fit a proportional hazards model to get an estimate of the treatment effect and adjust the analysis for other covariates
Important! Midpoint imputation is only reasonably when the time periods between consecutive visits are short. When the width of the interval increases, we may run into problems. Law and Brookmeyer (1992) showed that the statistical properties of midpoint imputation depend strongly on the width of the interval between visits. The authors noted that midpoint imputation, used to estimate the regression parameter in a proportional hazards model, might result in a biased estimate if the intervals are wide and varied. Also the standard error of the estimator is underestimated since midpoint imputation assumes that the failure times are exactly known when in fact they are not, (Kim 2003).
If the intervals are wide and varied • Use the non-parametric maximum likelihood estimator (NPMLE) to estimate and illustrate the survival distribution in each of the two treatment groups • Use a generalised log-rank test developed for interval-censored failure time data to test the hypothesis whether there is a significant treatment effect or not • Fit a regression model to the interval-censored observations to get an estimate of the treatment effect and to adjust the analysis for other covariates, e.g. fit an accelerated failure time (AFT) model to the interval-censored observations
1. The non-parametric maximum likelihood estimator • Peto (1973) was the first to propose a non-parametric method for estimating the survival function based on interval-censored data • Turnbull (1976) derived the same estimator, but used a different approach in estimation • In R: The package Icens includes many functions for the calculation of the non-parametric maximum likelihood estimator • In S-plus: Ongoing project to develop software that includes calculation of the non-parametric maximum likelihood estimator
2. The generalised log-rank test for interval-censored data • Sun (2005) discussed the non-parametric comparison of survival functions when only interval-censored failure time data are available. He proposed a class of non-parametric tests and presented both finite and asymptotic properties of the proposed test statistics. The proposed test statistics are generalisations of the regular log-rank test. • No software available
3. Regression models for interval-censored data • Accelerated failure time (AFT) models can be fitted to interval-censored observations both in SAS and S-plus. Several different failure time distributions are available (e.g. Weibull and log-normal). • AFT models involve stronger assumptions than e.g. the proportional hazards model. • The proportional hazards model could be fitted to interval-censored data, but there is no commercial software available.
Example: A breast cancer study 94 46 48 Combination treatment Radiation treatment
Example: A breast cancer study Patient Left Right Event Midpoint Trt 1 2 3 4 5 6 45 6 0 24 16 13 100 10 7 30 24 100 0 1 1 1 1 0 45 8 3.5 27 20 13 R R R C C C
Example: A breast cancer study • Use the midpoints and the Kaplan-Meier estimator to estimate the survival functions for the two treatment groups • Also use the non-parametric maximum likelihood estimator to estimate the survival functions for the two treatment groups • Use the midpoints and perform a log-rank test • Also perform the generalised log-rank test developed for interval-censored failure time data
Example: A breast cancer study The Kaplan-Meier estimator and the Non-Parametric Maximum Likelihood estimator
Example: A breast cancer study • The log-rank test using the midpoints: p-value = 0.001 • The generalised log-rank test for interval-censored data: p-value = 0.007
References Alioum, A. and Commenges, D. (1996) A proportional Hazards Model for Arbitrarily Censored and Truncated Data. Biometrics 52, 512-524. Finkelstein, D. (1986) A proportional Hazards Model for Interval-Censored Failure Time Data. Biometrics 42, 845-854. Sun, J. (1996) A non-parametric test for interval-censored failure time data with application to aids studies. Statistics in Medicine 15, 1387-1395. Sun, J. and Zhao, Q. (2005) Generalised Log-Rank Tests for Interval-Censored Failure Time Data. Scandinavian Journal of Statistics 32, 49-57. Law, G. and Brookmeyer, R. (1992) Effects of mid-point imputation on the analysis of doubly censored data. Statistics in Medicine 11, 1569-1578. Kim, J. (2003) Maximum likelihood estimation for the proportional hazards model with partly interval-censored data. J. R. Statist. Soc. B. 65, 489-502.