SNP comparisons
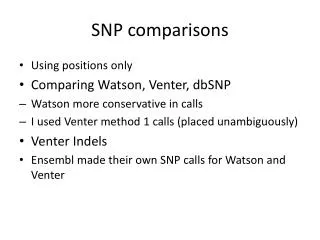
SNP comparisons. Using positions only Comparing Watson, Venter, dbSNP Watson more conservative in calls I used Venter method 1 calls (placed unambiguously) Venter Indels Ensembl made their own SNP calls for Watson and Venter. dbSNP 12,350,000 Venter 3,325,000 Watson 2,060,000. SNPs.

SNP comparisons
E N D
Presentation Transcript
SNP comparisons • Using positions only • Comparing Watson, Venter, dbSNP • Watson more conservative in calls • I used Venter method 1 calls (placed unambiguously) • Venter Indels • Ensembl made their own SNP calls for Watson and Venter
dbSNP 12,350,000 Venter 3,325,000 Watson 2,060,000 SNPs 1,032,000 1,817,000 233,000 476,000 210,000 Venter and Watson each have 3 variants that are in LSDBs. 10, 000
ORegAnno (regions from 1 bp to over 5000 bps) • 5,391 (Venter 7,253) SNPs that overlap ORegAnno • 3,519 (3,956) ORegAnno regions overlap the SNPs • 2,571 ORegAnno regions are the same • 27 (36) are in 1 bp regions • All are also in dbSNP • 11 are same
Venter’s Indels • 486,598 non-dbSNP variants • 280,722 SNPs • 205,875 indels • Only 94 of these are in coding exons • 65 are frame shifts • Found GO terms for 41 entries. • 37 cellular • 33 function • 34 process • GO:0005515 {14} protein binding (Molecular function) • GO:0016020 {13} membrane (Cellular component) • GO:0005634 {13} nucleus (Cellular component) • GO:0016021 {9} integral to membrane (Cellular component) • GO:0005622 {7} intracellular (Cellular component) • GO:0004872 {7} receptor activity (Molecular function) • GO:0005509 {6} calcium ion binding (Molecular function)
Ensembl • Ensembl made their own calls on the SNPs from Venter and Watson’s sequences • Need Ensembl 49 for accurate Venter SNPs
Ensembl Venter and Venter method1 2,602,178 95% in dbSNP 723,352 56% in dbSNP 766,195 64% in dbSNP dbSNP 128 chromosome reports
Ensembl Watson and Watson 1,602,563 100% in dbSNP 798,567 100% in dbSNP 457,981 53% in dbSNP dbSNP 128 chromosome reports
SNPs in Ultra Conserved Regions • dbSNP 128 has 168 • Watson and Venter have 25 • 16 of which are in dbSNP • 9 new (none from Ensembl) • chr1 115081716 W • chr1 115081717 W • chr1 50872068 W • chr3 153647146 W • chr6 163911701 V • chr9 139162434 W • chr11 8274734 W • chr15 65665291 V • chr18 21119518 W
SNPs in Ultra conserved regions • 3 % of Ultra conserved regions have either Watson or Venter SNPs • 25 % of Ultra conserved regions have SNPs from dbSNP 128 (168 SNPs), most have 1 or 2 • With a maximum of 12 SNPs in one region • A runner up of 5 SNPs in one region
What’s in Ultra Conserved regions? • Total 481 region • 480 have conserved TFBS • 168 have Vista Enhancers from LBNL • 72 have coding exons (only 19 with SNPs) • 124 have SNPs (dbSNP 128) • 2 more interesting UCs • UC without a conserved TFBS • UC with TFBS, SNP, Coding, and Repeat masker
SNPs in Conserved TFBS • About 3% of the 3.8 million binding sites have SNPs in dbSNP 128 • About 3% of the .8 million binding sites with a z score >= 2.33 have SNPs in dbSNP 128
SNP density This is computed on a 10kb window. The weighted average is computed for each window.
SNPs in ORegAnno regions Of the 9,427 ORegAnno regions (excluding TFBS), 1,603 of them have no SNPs from dbSNP 126 (from UCSC).
SNPs per exon Venter SNPs Percentages close in both Venter’s set and Ensembl’s. 93 % none 5% 1 SNP 2% >1 SNP
SNP locations nt counts • Watson 2,060,544 • Venter method 1 3,325,530
SNP coverage This is computed on 10kb non-overlapping windows. If there is 1 SNP in the window it gets a 1 otherwise a zero. The darker areas indicate sections where it jumps between 0 and 1 more often. A white area with a blue line at the top has at least 1 SNP per 10kb consistently.