Download
1 / 47
470 likes | 565 Vues
Discover how satellite data improves model performance for air quality evaluation. Learn about analyzing fire emissions, comparing CMAQ with MODIS and AERONET, and evaluating ground temperature outputs. Explore tools such as MODIS, MOPITT, GOES, and AERONET for in-depth analysis.

E N D
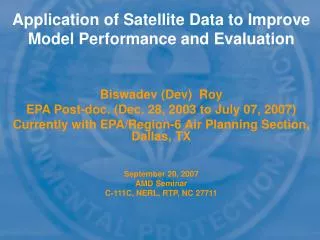
Biswadev (Dev) Roy EPA Post-doc. (Dec. 28, 2003 to July 07, 2007) Currently with EPA/Region-6 Air Planning Section, Dallas, TX September 20, 2007 AMD Seminar C-111C, NERL, RTP, NC 27711 Application of Satellite Data to Improve Model Performance and Evaluation
EPA Post-doc Projects 1. Improvement of fire emissions inventory using satellite information - study impact of wildfire emissions reallocations on CMAQ - compare CMAQ predicted CO columns with MOPITT - use MODIS fire count information and ground observations record for creating 2005 fire emissions for NEI 2. Compare CMAQ optical depth with MODIS observations - compare CMAQ w/AERONET, MODIS and IMPROVE - develop PM2.5-AOD relationship 3. Evaluation of MM5 ground temperature output - compare with aircraft, GOES, and MODIS - inter-relate skin temperature errors with PBL height errors MODIS CMAQ MOPITT
Data Sources • MODIS: Moderate Resolution Imaging Spectroradiometer • MOPITT: Measurement of Pollution in the Troposphere (correlation radiometer) • GOES: Geost. Operational Environmental Satellite • AERONET: NASA/Aerosol Robotic Network • IMPROVE: Interagency monitoring network for class I areas • STN: monitoring network for urban areas • MTP: microwave temperature profiler (JPL) TEXAQS I • Heimann IR Probes: aircraft mounted sensor (JPL) TEXAQS I
1. Study the impact of fire emissions reallocation using MODIS fire signatures Objective: • Reallocate NEI using MODIS fire signatures and check its impact on CMAQ using PM2.5 and Total Carbon data from IMPROVE With: George Pouliot, Alice Gilliland, Tom Pierce, Bill Benjey, Prakash Bhave, and Steven Howard
Steps taken for “emissions reallocation” • MODIS Fire-pixel counts were gridded into respective CMAQ grid cells • 90% of the NEI monthly prescribed burns and wildfire emissions for each state-month are distributed in space and time using the MODIS fire counts -- State’s monthly emissions in the NEI were multiplied by fraction of pixel count for each grid cell over the monthly count for the state and by the fraction of each grid cell in that particular state -- Spatially reallocated emissions were distributed temporally using the ratio of the pixel count per day and pixel count per month for each grid cell
CMAQ Options MM5-CMAQ ● Pre-release version of CMAQ 4.4 used ● Simulations using CB-IV chemical mechanism ● Modal Aerosol Model and ISORROPIA thermodynamic equilibrium model ● Chemical BC’s for CMAQ based on GEOS-CHEM ● Meteorological inputs from MM5, 34 vertical layers collapsed to 14 layers ● 36 km x 36 km horizontal grid
MODIS RR fire pixel counts Reallocated minus base case PM2.5 emission rates in g s-1 & OC+EC
Monthly average spatial plot of CMAQ total carbon before and after emissions reallocation for May and August 2001 r=0.36 May (Base) r=0.58 May (Reallocated) r=0.26 August (Base) r=0.51 August (Reallocated)
Monthly average spatial plot of CMAQ predicted PM2.5before and after emissions reallocation for May and August 2001 r=0.82 r=0.84 r=0.64 r=0.75
1b. CMAQ CO evaluation using MOPITT • Improvement of fire emissions inventory using satellite information - study impact of wildfire emissions reallocations on CMAQ - compare CMAQ predicted CO columns with MOPITT obs. - use MODIS fire count information and ground observations record for creating 2005 fire emissions for NEI • Compare CMAQ optical depth with MODIS observations - compare CMAQ w/AERONET, MODIS and IMPROVE - develop PM2.5-AOD relationship • Evaluation of MM5 ground temperature output - compare with aircraft, GOES, and MODIS - inter-relate skin temperature errors with PBL height errors • While reallocating fire emissions does it improve CO comparison with data? With: J. Szykman (EPA/NASA), C. Kittaka (NASA/LaRC/SAIC), Jim Godowitch, and Tom Pierce
Passive MOPITT does not match CMAQ vertical resolution hence weighting fn. used I=Identity Matrix A=Avg. kernel C=error cov. matrix Using ‘weighting function’ the mixing ratio is adjusted at each level due to effects of all possible levels.
CMAQ Column CO Base and Reallocated columns with MOPITT Initial CMAQ MOPITT Data Revised CMAQ
CMAQ CO vs. MOPITT CO at MOPITT pressure levels Base Fire Emissions and Reallocated Fire Emissions - August 22-31Pacific Northwest Domain
1c. 2005 fire emissions • Improvement of fire emissions inventory using satellite information - study impact of wildfire emissions reallocations on CMAQ - compare CMAQ predicted CO columns with MOPITT - use MODIS fire count information and ground observations record for creating 2005 fire emissions • Compare CMAQ optical depth with MODIS observations - compare CMAQ w/AERONET, MODIS and IMPROVE - develop PM2.5-AOD relationship • Evaluation of MM5 ground temperature output - compare with aircraft, GOES, and MODIS - inter-relate skin temperature errors with PBL height errors • Develop relationship between ground-based area burned and MODIS fire counts for 2002 and use the same for creating 2005 fire emissions With: George Pouliot, Tom Pace, David Mobley, and Tom Pierce
TERRA Terra collects data on “descending” node AQUA Aqua collects data on “ascending” node
Estimate Burned Area using Np A is area burned in a spatial region labeled by index ‘i’ and during a fixed time period labeled by index ‘t’ Np = No. of fire pixels obs. within the same region during same time period α=constant Area Burned/Np obtained Region-wise
Scheme for MODIS pixel clustering and match up with ground-reports Adjacency test: L = lifetime of the fire; n = no. of obs.
Burned Area in Acres/month and PM2.5 Emissions - 2002 Spring: Prescribed Summer: wildfire
MODIS Imagery, Aug. 12, 2002 C2 C2 C2 C1 C1 MODIS imagery August 12, 2002 and PM2.5 emissions from Biscuit Fire, OR. using Np-Area burned relationship NEI: All emissions in 1 grid; Satellite : aids in spatial re-distribution: removal of excess NOx hence over-estimate of surface ozone
Summary on wildfire emissions study • Emissions reallocation has re-distributed the total carbon concentrations from state-wide extent to a more localized fashion • Transport patterns suggest that the MM5 simulation captured shifts in wind direction adequately • Reallocated CMAQ simulation adjusted with plume-rise predicts higher total carbon concentration • Emissions reallocation can reduce biases in the base simulation of total carbon during non-fire periods • Emissions reallocation yield a better correlation with IMPROVE data obtained from locations having a significant separation from the fire location • CMAQ CO columns agree better after using MOPITT kernels • MODIS fire detect information can improve spatial and temporal allocation of emissions from large fires with a high degree of confidence.
2a, 2b CMAQ AOD comparison • Improvement of fire emissions inventory using satellite information - study impact of wildfire emissions reallocations on CMAQ - compare CMAQ predicted CO columns with MOPITT - use MODIS fire count information and ground observations record for creating 2005 fire emissions for NEI • Compare CMAQ optical depth with MODIS observations - compare CMAQ w/AERONET, MODIS and IMPROVE - spatial variability of AOD and develop PM2.5-AOD relationship • Evaluation of MM5 ground temperature output - compare with aircraft, GOES, and MODIS - inter-relate skin temperature errors with PBL height errors To thoroughly characterize the performance of the emissions meteorological and chemical transport modeling components of the Models-3 system 2a: With Rohit Mathur, Alice Gilliland, and Steven Howard 2b: With Adam Reff, Brian Eder & Steven Howard
Two fold objective -- evaluation of CMAQ AOD • To thoroughly characterize the performance of the emissions, meteorological and chemical/transport modeling components of the Models-3 system and build confidence within community. • To pursue inter-relating satellite AOD with PM2.5 (modeled and measured).
CMAQ and Terra/MODIS AOD comparison ● Satellite Aerosol Optical Depth (AOD) products offer new and challenging opportunities for studying regional distribution of particulate matter and scopes for rigorous operational evaluation of modeling systems ● EPA standards are based on total PM2.5 hence it is important to assess model performance of total PM2.5 and the impact of CMAQ model performance for individual species on the total. -- First need to establish whether AOD satellite data can be useful as additional information for PM2.5 model evaluation. -- Summer period of 2001 selected
CMAQ-Terra/MODIS comparison 14 Layer
CMAQ AOD Method Based on Reconstructed Mass-Extinction Method (Malm et al. 1994, Binkowski & Roselle, 2003)‘Reconstructed’ extinction coefficients are based on assumption that organic mass is soluble up to 50% by mass ●OM=Organic mass, FS=Fine Soil, LAC=Light Absorbing Carbon (elemental carbon), CM=Coarse mass. Concentration are in mg m-3 ● The specific scattering coefficient 0.003, 0.004, 0.001 and 0.0006 are based on assuming log-normal particle size distribution. ● Modeled pressure, water-vapor mixing ratio and temperature are used to compute the vapor pressure and RH. ● Layer RH value is used to calculate the exact humidity growth factor from an LUT (Malm et al. 1994; Binkowski & Roselle, 2003)
CMAQ AOD vs MODIS AOD on some eventful days Regional Pattern ---Frontal activity
Time-series of CMAQ AOD, SSA and MODIS AOD CMAQ Grid-cell [114, 30] having large fire in FL (May 19-29) CMAQ Grid-cell [30, 90] having large fire in WA. (Aug 11-21)
MODIS AOD (0-4 scale) MAY 24, 2001 MODIS AOD (0-4 scale) MAY 25, 2001 Wildfire signature on MODIS AOD
Fractional SO4 AOD Fractional BC AOD Fractional NO3 AOD Fractional A25 AOD Fractional CM AOD Fractional NH4 AOD Fractional OC AOD August 2001 Fract. AOD Sulfate contributes ~ 40%
MODIS Avg. AOD JJA 2001 CMAQ AOD X 2 JJA 2001 2*cmaq aod
AOD NMB and NME: JJA 2001 Normalized mean error : (ΣABS(Model-Obs)/ΣObs) * 100: Normalized mean bias : (Σ(Model-Obs)/ΣObs) * 100
Satellite AOD Imputation performed for cloudy days Non-cloudy: (Modis-AOD/Cmaq-AOD) Ratio Mean Ratio for each Land Use Type Gamma distribute Ratio for each LUSE Cloudy Day: Use distribution to draw Ratio for LUSE Ratio * Cmaq-AOD = Imputed AOD
Summary on AOD study for JJA 2001 • CMAQ surface extinction due to particle scattering compares well with the IMPROVE nephelometer data • Ratio of MODIS to CMAQ AOD is most of the time a factor of 1 to 10 higher than ratio of MODIS mass concentration to CMAQ PM2.5 mass concentration data • Mean difference between MODIS and CMAQ AOD columns is 0.2 • Sulfate is found to be a dominant contributor to CMAQ AOD • CMAQ AOD patterns reflect synoptic activities very clearly
3a. MM5 skin temperature evaluation • Improvement of fire emissions inventory using satellite information - study impact of wildfire emissions reallocations on CMAQ - compare CMAQ predicted CO columns with MOPITT - use MODIS fire count information and ground observations record for creating 2005 fire emissions for NEI • Compare CMAQ optical depth with MODIS observations - compare CMAQ w/AERONET, MODIS and IMPROVE - develop PM2.5-AOD relationship • Evaluation of MM5 ground temperature output - compare GT with aircraft, GOES, and MODIS -inter-relate skin temperature errors with PBL height errors • Comparison of MM5 GT with MODIS, GOES and aircraft obs. over Houston during TexAQS-2000 With: Jason Ching & Michael Mahoney (NASA/JPL)
Terra/MODIS land surface temperature product MOD11A1 1 km gridded day, night global data. Provides per-pixel temperature in Kelvin with a cross track view-angle dependent algorithm applied to observations. Accuracy: ~ 1oK for land use (IGBP) with known emissivity MOD11A1 1km LST Product Footnote: Processing & comparison with GOES & aircraft LST product: Data in integerized sinusoidal (ISIN) projection re-sampled to geographic system using MODIS Reprojection Tool v3.3. Environment for Visualization (ENVI v4.2) used for geo-referencing re-sampled data over the Texas domain. A fair correspondence found between 4km aggregated MODIS LST and 4km GOES LST for the hatched domain (GOES warmer by ~ 1.5K to 2.5K during daytime)
GOESTG night-time at 4 km windowed over HD1 MM5 T5 night-time at 1 km native over HD1 MODIS TM night-time at 1 km native over HD1 08/19 08/19 08/19 (a) (b) (c) MM5 T5 day-time at 1 km native over HD1 GOES TG day-time at 4 km windowed over HD1 MODIS TM day-time at 1 km native over HD1 (a) 08/19 08/19 08/19 (d) (e) (f) MM5 GT compares with GOES 4km windowed and MODIS 1km native
-6.0 -1.0 +3.0 ≈ 0.0 -2.5 +0.5 -4.0 ≈ 0.0 -4.0 -2.0 -2.5 +1.0 MODIS – Model (MM5)(1) MODIS-GOES(1, 2) NIGHT DAY NE NW NW NE SW SW (a) (b) Sector-wise difference in thermal property UCP data-rich zone (heavy built-up area)
Skin temperatures from MODIS provides a diagnostic indicator of model performance. • “Inside” Morphology database region: • Urbanized model predicts urban heat island successfully; i.e., model bias is small in urban sector when compared to MODIS. • Standard MM5 using Roughness approach produces poor description of the Houston heat island. Model bias is high in urban area. • “Outside” Morphology database region: • Model predictions of skin temperatures are problematic; an avenue to explore is the possibility of inaccurate land use specification. • Model UCP extrapolation methodology, reexamination of designation of land use in mesoscale models and their physical properties are needed. • Other simulation days, and nighttime results exhibit similar features
3b. Relate skin temperature error and PBL height error • Improvement of fire emissions inventory using satellite information - study impact of wildfire emissions reallocations on CMAQ - compare CMAQ predicted CO columns with MOPITT - use MODIS fire count information and ground observations record for creating 2005 fire emissions for NEI • Compare CMAQ optical depth with MODIS observations - compare CMAQ w/AERONET, MODIS and IMPROVE - develop PM2.5-AOD relationship • Evaluation of MM5 ground temperature output - compare with aircraft, GOES, and MODIS - inter-relate skin temperature errors with PBL height errors • Infer inter-relation between skin temperature and PBL height error using EMD/HT method
Block avg T, PBL Height & Spectra TFE Spectra - Temperature Temperature PBL Height Obs Heimann Probe Model MM5 GT TFE Spectra -PBL Height Obs Model Time --
Hilbert Spectra to ascertain Tskin-Mixing Ht. Relation Heimann Skin Temp. minus MM5 Skin Temp. MTP PBL Height minus MM5 Treating skin temperature & PBL height error (obs. Minus model) series as being non-stationary
Publications from CMAQ related projects • NEI Fire emissions using MODIS – 1 pub. In AE (reallocation-First Author); 1 pub. In Int. J. Appl. Rem. Sens. (with Pouliot) (Second author) • Evaluation of CMAQ AOD using Semi-Empirical method – 1 pub. (First Author) in JGR-A. • Evaluation of MM5 skin temp. using MODIS & GOES – 2 pubs.-Env. Model. Software; Rem. Sens. Environment (First author in both) • Evaluation of CMAQ Carbon Monoxide columns – 1 pub. (with Jim Szykman & LaRC team) Geophys. Res. Lett. (Third author) • CMAQ AOD spatial variability and connection with surface PM2.5 – 1 pub. Geophys. Res. Lett. (with Reff & Eder) Published Being PreparedReady for Communication