
Analysis of Atrial Pacing and RF Delivery Effects Across Multiple Heart Regions
This document presents an in-depth analysis of atrial pacing protocols, including pCS and AIRA pacing across various heart regions (H1-10), highlighting the differences in responses before and after RF delivery. Data from figures illustrate the variations in pacing dynamics and ablation outcomes at different time intervals such as 140 ms and 155 ms post-delivery, providing key insights into optimal pacing strategies for improved cardiac outcomes. The findings aim to enhance understanding of atrial dynamics in clinical settings.

Analysis of Atrial Pacing and RF Delivery Effects Across Multiple Heart Regions
E N D
Presentation Transcript
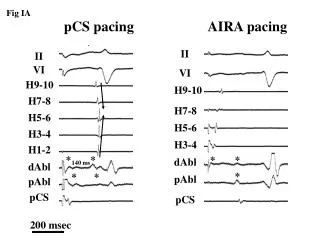
Fig IA pCS pacing AIRA pacing II II VI VI H9-10 H9-10 H7-8 H7-8 H5-6 H5-6 H3-4 H3-4 H1-2 * * * * dAbl 140 ms dAbl * * * pAbl pAbl pCS pCS 200 msec
Fig IB pCS pacing AIRA pacing II II VI VI H9-10 H9-10 H7-8 H7-8 H5-6 H5-6 H3-4 H3-4 * * H1-2 dAbl * * * * 180 ms dAbl mAbl * * * * pAbl pAbl pCS pCS 200 msec
Fig II Before RF delivery After RF delivery II VI H9-10 H7-8 H5-6 H3-4 155 ms 155 ms H1-2 * * * dAbl * * * * mAbl * * * * pAbl * * * 200 msec