Download
1 / 81
820 likes | 1.02k Vues
Using Applied Mathematics to Assess Hurricane Risk. Kerry Emanuel Program in Atmospheres, Oceans, and Climate Massachusetts Institute of Technology. Limitations of a strictly actuarial approach. >50% of all normalized damage caused by top 8 events , all category 3, 4 and 5

E N D
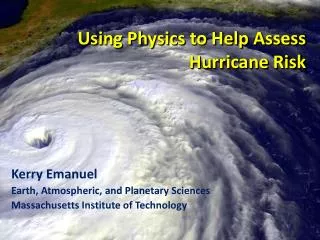
Using Applied Mathematics to Assess Hurricane Risk Kerry Emanuel Program in Atmospheres, Oceans, and Climate Massachusetts Institute of Technology
Limitations of a strictly actuarial approach • >50% of all normalized damage caused by top 8 events, all category 3, 4 and 5 • >90% of all damage caused by storms of category 3 and greater • Category 3,4 and 5 events are only 13% of total landfalling events; only 30 since 1870 • Landfalling storm statistics are inadequate for assessing hurricane risk
Atlantic Sea Surface Temperatures and Storm Max Power Dissipation (Smoothed with a 1-3-4-3-1 filter) Years included: 1870-2006 Power Dissipation Index (PDI) Scaled Temperature Data Sources: NOAA/TPC, UKMO/HADSST1
Risk Assessment by Direct Numerical Simulation of Hurricanes:The Problem • The hurricane eyewall is a region of strong frontogenesis, attaining scales of ~ 1 km or less • At the same time, the storm’s circulation extends to ~1000 km and is embedded in much larger scale flows
Global Models do not simulate the storms that cause destruction Modeled Histograms of Tropical Cyclone Intensity as Simulated by a Global Model with 50 km grid point spacing. (Courtesy Isaac Held, GFDL) Observed Category 3
Numerical convergence in an axisymmetric, nonhydrostatic model (Rotunno and Emanuel, 1987)
How to deal with this? • Option 1: Brute force and obstinacy
How to deal with this? • Option 1: Brute force and obstinacy • Option 2: Applied math and modest resources
Time-dependent, axisymmetric model phrased in R space • Hydrostatic and gradient balance above PBL • Moist adiabatic lapse rates on M surfaces above PBL • Boundary layer quasi-equilibrium convection • Deformation-based radial diffusion • Coupled to simple 1-D ocean model • Environmental wind shear effects parameterized
How Can We Use This Model to Help Assess Hurricane Risk in Current and Future Climates?
Risk Assessment Approach: Step 1: Seed each ocean basin with a very large number of weak, randomly located cyclones Step 2: Cyclones are assumed to move with the large scale atmospheric flow in which they are embedded, plus a correction for beta drift Step 3: Run the CHIPS model for each cyclone, and note how many achieve at least tropical storm strength Step 4: Using the small fraction of surviving events, determine storm statistics Details: Emanuel et al., Bull. Amer. Meteor. Soc, 2008
Synthetic Track Generation:Generation of Synthetic Wind Time Series • Postulate that TCs move with vertically averaged environmental flow plus a “beta drift” correction • Approximate “vertically averaged” by weighted mean of 850 and 250 hPa flow
Synthetic wind time series • Monthly mean, variances and co-variances from re-analysis or global climate model data • Synthetic time series constrained to have the correct monthly mean, variance, co-variances and an power series
Risk Assessment Approach: Step 1: Seed each ocean basin with a very large number of weak, randomly located cyclones Step 2: Cyclones are assumed to move with the large scale atmospheric flow in which they are embedded, plus a correction for beta drift Step 3: Run the CHIPS model for each cyclone, and note how many achieve at least tropical storm strength Step 4: Using the small fraction of surviving events, determine storm statistics Details: Emanuel et al., Bull. Amer. Meteor. Soc, 2008
Comparison of Random Seeding Genesis Locations with Observations
Cumulative Distribution of Storm Lifetime Peak Wind Speed, with Sample of 1755Synthetic Tracks 95% confidence bounds
Coupling large hurricane event sets to surge models (with Ning Lin) • Couple synthetic tropical cyclone events (Emanuel et al., BAMS, 2008) to surge models • SLOSH • ADCIRC (fine mesh) • ADCIRC (coarse mesh) • Generate probability distributions of surge at desired locations
Example: Intense event in future climate downscaled from CNRM model
Summary: • History too short and inaccurate to deduce real risk from tropical cyclones • Global (and most regional) models are far too coarse to simulate reasonably intense tropical cyclones • Globally and regionally simulated tropical cyclones are not coupled to the ocean
We have developed a technique for downscaling global models or reanalysis data sets, using a very high resolution, coupled TC model phrased in angular momentum coordinates • Model shows skill in capturing spatial and seasonal variability of TCs, has an excellent intensity spectrum, and captures well known climate phenomena such as ENSO and the effects of warming over the past few decades
Ocean Component: ((Schade, L.R., 1997: A physical interpreatation of SST-feedback. Preprints of the 22nd Conf. on Hurr. Trop. Meteor., Amer. Meteor. Soc., Boston, pgs. 439-440.) • Mixing by bulk-Richardson number closure • Mixed-layer current driven by hurricane model surface wind
Couple to Storm Surge Model (SLOSH) Courtesy of Ning Lin
Histogram of the SLOSH-model simulated storm surge at the Battery for 7555 synthetic tracks that pass within 200 km of the Battery site.
Why does frequency decrease? Critical control parameter in CHIPS: Entropy difference between boundary layer and middle troposphere increases with temperature at constant relative humidity
Probability Density by Storm Lifetime Peak Wind Speed, Explicit and Downscaled Events
Analysis of satellite-derived tropical cyclone lifetime-maximum wind speeds Trends in global satellite-derived tropical cyclone maximum wind speeds by quantile, from 0.1 to 0.9 in increments of 0.1. Box plots by year. Trend lines are shown for the median, 0.75 quantile, and 1.5 times the interquartile range Elsner, Kossin, and Jagger, Nature, 2008
Theoretical Upper Bound on Hurricane Maximum Wind Speed:POTENTIAL INTENSITY Surface temperature Ratio of exchange coefficients of enthalpy and momentum Outflow temperature Air-sea enthalpy disequilibrium