Download
1 / 34
340 likes | 564 Vues
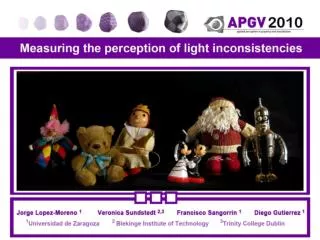
Goal and Motivation. Goal and Motivation. To study our (in)ability to detect inconsistencies in the illumination of objects in images Invited Talk! Hany Farid: Photo Forensincs: Lighting and Shadows. Goal and Motivation. Goal and Motivation.

E N D
Goal and Motivation • To study our (in)ability to detect inconsistencies in the illumination of objects in images • Invited Talk! • Hany Farid: Photo Forensincs: Lighting and Shadows
Goal and Motivation • Suggest thresholds for error limits in image-based light detection algorithms • Underconstrained pb.
Previous work • Todd and Mingolla [1983] low accuracy of HVS using lightprobes to infer light direction • [Mingolla and Todd 1986] HVS does not assume objects as diffuse by default. • Koenderik et al. [2004] HVS increases accuracy detecting the light field direction when shadow boundaries are present.
Previous work • [Ostrovsky et al. 2005] HVS can easily spot an anomalously lit object in an array of identical objects with the same orientation and lit exactly the same. • O’Shea et al. [2008] for unknown geometries the angle between the viewing direction and the light direction is assumed to be 20-30 degrees above the viewpoint. • Did I mention the invited talk already?
Overview • Experiment #1 The goal is to suggest a general threshold for diffuse and shiny objects under different light configurations.
Overview • Experiment #1 The goal is to suggest a general threshold for diffuse and shiny objects under different light configurations. • Experiment #2 Analysis of the influence of texture properties (spatial frequency) in the perception process.
Overview • Experiment #1 The goal is to suggest a general threshold for diffuse and shiny objects under different light configurations. • Experiment #2 Analysis of the influence of texture properties (spatial frequency) in the perception process. • Experiments #3 and #4 Designed to explore how well our findings carry over to real images. Experiments with modified photographs as stimulus.
Experiment #1 • A series of images were shown. All with several objects lit (directional lighting) from the same angle… except for one • Select the inconsistently lit object in each image • The images were randomly presented • Only vary the more restrictive slant angle [Koenderink 04]
Experiment #1 • Example of image used in the test
Experiment #1 • This experiment had 3 dimensions: • Angle of divergence: 0-90 degrees, in 10-degree increments • Spatial configuration of lights : both in the front, both in the back, mixed • Shininess property: Highlights - NO Highlights
Experiment #1 • In total 10x2x3 = 60 images were generated • 55 participants took the test: ages 16-58, 33 male, 22 female. 18 had an artistic background.
Experiment #1: Results • Up to 20 degrees of divergence the probability of detection is around chance (12:5%). • If both lights are in the front: up to 30 degrees • agree with [Koenderink et al. 2004] which suggested that shaded areas and self-shadows increase our accuracy.
Experiment #1: Results • The performance of HVS is slightly lower when highlights are present Todd and Mingolla’s [1983] • Diverges from some computer vision approaches which do use highlights as visual cues [Lagger and Fua 2006].
Experiment #2 • We aim to analyze the influence in the perception process of the spatial frequency of the texture. • The psychophysical test consists of a new series of images, which has been shown to 32 users (ages 22-57; 23 male and 9 female). • The test was displayed using the same methodology as in Experiment One.
Experiment #2 • Example of image from the test. Four textures with different spatial frequency x 10 divergence degrees = 40 images shown to each user.
Experiment #2: Results • Responses provided by users in the test, shown by texture frequency.
Experiment #2: Results • Higher frequencies do mask lighting inaccuracies up to the detection threshold of 20-30 degrees, making the detection task more difficult. • For angles > 40 degrees we found no significant difference (p > 0:05) in the results the visual system may not take intensity variations due to the surface material as suggested in [Khang et al. 2006]
Experiment #3 • This test consists of a simple scene containing a set of eight real objects • The scene was photographed three times: the original scene, plus two more with the angle of the main light source varying 20 and 30 degrees respectively. • Two images were obtained by compositing the original image with a pair of objects (ceramic purple doll and the Venus figurine) from the two images with varying light sources.
Experiment #3 • 25 users (ages 17-62, 14 male and 11 female) • Each user was shown one image with two inconsistently lit objects (both 20 or 30 degrees). • They were asked the following question: In the following image one or two objects have been inserted and they have a different illumination than the rest of the scene. Could you point it/them out?
Experiment #3 • Hit ratio is below chance for one (40,625%) and two objects (3,125%) with both 20 and 30 degrees of divergence. • These results motivate the test #4.
Experiment #4 • This test is designed to narrow the threshold range anticipated in tests #1 and #3 for real images. • Nine versions of a new scene were generated. • Four photographs of the same scene were taken at 0, 20, 30 and 40 degrees of divergence from a reference direction. • Three objects were masked out and only one object was combined at a time 3 objects x 3 directions = 9 images.
Experiment #4 • The objects with light modified illumination.
Experiment #4 • 60 users (ages 18-59, 38 male and 22 female) • Each user was shown three images with a random inconsistently lit object at 20, 30 and 40 degrees of divergence. • The same object was never shown more than once per user.
Experiment #4 • The results show a trend similar to the tests with synthetic objects • However the thresholds are more conservative (30-40 degrees instead of 20-30) • Reasons richer visual cues? Naturalness of the scene?
Conclusions • We have presented four different tests to measure the accuracy of human vision detecting lighting inconsistencies in images. • The results of our experiments agree with previous research [Ostrovsky et al. 2005; Koenderink et al. 2004; Lopez-Moreno et al. 2009]. • We suggest a perceptual threshold for multiple configurations: materials, position of light sources,… .
Acknowledgments • This research was partially funded by a generous gift from Adobe Systems Inc, the Gobierno de Aragόn (projects OTRI 2009/0411 and CTPP05/09) and the Spanish Ministry of Science and Technology (TIN2007-63025).