Download
1 / 13
140 likes | 282 Vues
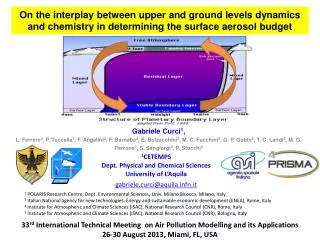
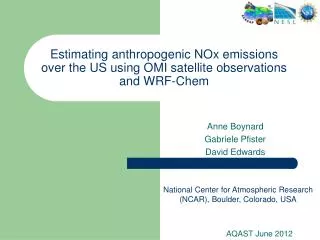
Estimating anthropogenic NOx emissions over the US using OMI satellite observations and WRF- Chem. Anne Boynard Gabriele Pfister David Edwards. National Center for Atmospheric Research (NCAR), Boulder, Colorado, USA. AQAST June 2012. Motivation.

E N D
EstimatinganthropogenicNOxemissionsover the US using OMI satellite observations and WRF-Chem Anne Boynard Gabriele Pfister David Edwards National Center for Atmospheric Research (NCAR), Boulder, Colorado, USA AQAST June 2012
Motivation Better quantify anthropogenic NOx emissions, which can have large uncertainty [e.g. Street et al., 2003] • NO2 satellite observations are a perfect source of information to constrain NOx emission estimates: • Global coverage • Good spatial resolution • Sensitivity towards the surface • Short lifetime of NOx => short transport scale
Top-down Approach Martin et al. [2003, 2006] Lamsal et al. [2011] = Adjustment of the emissions with satellite observations to reduce the disagreement between model and observation. Assuming that horizontal transport of NOx is negligible, a posteriori emissions can be derived as following: α = ENOX_apriori/ NO2_model => ENOX_aposteriori= α x NO2_satellite NO2_satellite NO2_model α ENOX ENOX = anthropogenic NOx emissions NO2_model= Modeled NO2 Tropospheric Column NO2_satellite= Satellite NO2 Tropospheric Column
Model & Data A priori anthropogenic NOx emissions US EPA 2005 NEI Modeled NO2 Tropospheric Column WRF-Chem 24km x 24km 10 June – 10 July 2008 Satellite NO2 TroposphericColumn OMI DOMINO data [Boersma et al., 2007] • Average over 9 grid boxes • (72km x 72km horizontal resolution) • α is applied only for grid boxes where • anthropogenic NOxemissions > 90% Total emissions Weacknowledge the free use of tropospheric NO2 column data from the OMI sensorfromwww.temis.nl
OMI/WRF-chem (w/ 2005 NEI) comparison Larger discrepancy over cities 10 June – 24 June 2008
OMI/WRF-chem (w/ a posteriori emissions) comparison Bias has significantly decreased but we still see large differences locally (e.g. in California) 10 June – 24 June 2008
A priori versus A posteriori Emissions Over the CONUS: reduction in anthropogenic emissions of ~7.5% => Reduction in NOx emissions consistent with EPA Trend data & EDGAR database 10 June – 10 July 2008
Change in surface Ozone (20UTC) O3 w/ a posteriori – O3 w/ a priori Over most of the cities, when NOx emissions decrease, O3 increases =>This might have important policy implications for urban areas where NOx emissions are controlled
New Top-Down Approach: XNOX Method Using the "total NO2”, we attribute the entire NO2 column to anthropogenic sources while it includes other sources (e.g. fire, biogenic sources) Anthropogenic NO2 (XNO2) is tagged in our WRF-Chem simulation (chemically active species) Idea: Using modeled anthropogenic NO2 Trop. Column instead of modeled total NO2 Trop. Column to estimate a posteriori emissions • This method allows to get a well defined linear relation between anthropogenic NOx emissions and anthropogenic NO2 Trop. Column Question: How things change?
XNO2 contribution to NO2 XNO2 > 0.8 * NO2 • When XNOX > 0.8 * NO2 : cities but also power plants show • This method indicates regions where the NOx emission constraint can be applied with high confidence 10 June – 10 July 2008
Martin et al. method versus XNOX method Anthropogenic NOxemissions Difference between XNOX and Martin et al. method Increase of NOx emissions of ~10 to 30% with the XNOX method
Summary • Anthropogenic NOx emissions were estimated over the US during summer 2008 using WRF-Chem and OMI satellite data • EPA 2005 NEI was constrained using a top-down approach • Bias between model and observations was reduced by 8% using the adjusted emission inventory • The results indicated that EPA 2005 NEI might overpredictNOx emissions over cities (up to 50%) – large impact on surface O3 • Anthropogenic NO2 tracers indicated that this method really only works well over high emission hot spots (cities – power plants)
THANK YOU! Anne Boynard Gabriele Pfister David Edwards National Center for Atmospheric Research (NCAR), Boulder, Colorado, USA AQAST June 2012