Download
1 / 31
310 likes | 398 Vues
Explore the MUDIM system for medical data mining, expert systems, and compositional models focused on conditional independence and causality in multidimensional compositional models. Utilize the STULONG dataset and analyze correlations in cardiovascular risk factors.

E N D
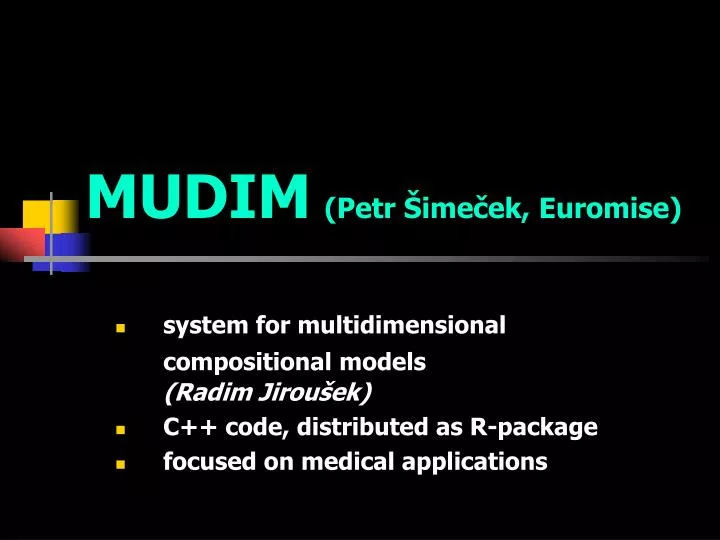
MUDIM(Petr Šimeček, Euromise) system for multidimensional compositional models(Radim Jiroušek) C++ code, distributed as R-package focused on medical applications
Contents: • idea of conditional independence and (de)composition • possible applications of MUDIM • expert system • data mining • STULONG dataset
CI - Theory of Storks BIRTH RATE STORKPOPULATION
CI - Theory of Storks Do storks deliver newborns? Statisticallyconnected BIRTH RATE STORKPOPULATION
CI - Theory of Storks ENVIRONMENT No! BIRTH RATE STORKPOPULATION
ENVIRONMENT connected connected BIRTH RATE STORKPOPULATION CI - Theory of Storks
CI – Weather WEATHERTODAY WEATHERYESTERDAY WEATHERTOMORROW
CI – Weather WEATHERTODAY WEATHERYESTERDAY WEATHERTOMORROW
CI – Sample Medical Data = variable (attribute); f.e. AGE, BLOOD PREASURE, …
CI – Sample Medical Data = variable (attribute); f.e. AGE, BLOOD PREASURE, … = (unconditional) statistical connection(correlation) betweenthepair of variables
CI – Storks & Weather ENVIRONMENT BIRTH RATE STORKPOPULATION TODAY YESTERDAY TOMORROW
CI – Storks & Weather ENVIRONMENT BIRTH RATE STORKPOPULATION TODAY YESTERDAY TOMORROW
= causality betweenthe pair of variables CI – Sample Medical Data = variable (attribute); f.e. AGE, BLOOD PREASURE, …
Locality - illustration Variable X Directly explanatoryvariables for X Other variables If we know information about directly explanatoryvariables for X, then knowledge about other explanatory variables is useless for predicting X.
Applications – Expert Systems Causality
Applications – Expert Systems Causality
Applications – Expert Systems Causality
Applications – Expert Systems Causality
Applications – Expert Systems Causality
Applications – Expert Systems What is the distribution of if we know ? Causality
Data Mining We don’t know “anything”, there are lots of variables and lots of possiblerelations between them. We need to formulate possible hypothesis, suggest some promising models, etc. (useful in pre-research).
Data Mining Variables Data
Direction of Causality Problem is equivalent to are equivalent, but they are notequivalent to
STULONG Dataset = Dataset containing research data on cardiovascular disease(1976-79) • 1417 patients (Czech middle-aged men) • 244 attributes surveyed with each patient at the entry examination • 37 selected attributes are described here
(Incomplete) List of Attributes • MYOCARDIALINFARCTION • HYPERTENSION • ICTUS • HYPERLIPIDEMIA • CHEST PAIN • ASTHMA • HEIGHT & WEIGHT • BLOOD PREASURE • … • AGE • MARITAL STATUS • EDUCATION • OCCUPATION • PHISICAL ACTIVITY • TRANSPORT TO JOB • SMOKING • ALCOHOL • TEA AND COFFEE
Graph of Correlated Pairs 464 of 666possible pairs are statistically connected (p=0.05)
Graph of Correlated Pairs 2 160 of 666possible pairs are statistically connected (p=0.05/666)
Risk Factors for Hypertension >summary(glm(HT~HYPLIP+IM+AGE+SUBSC,data=C,family="binomial")) Coefficients: Estimate Std. Error z value Pr(>|z|) Estimate Std. Error z value Pr(>|z|) (Intercept) -4.322730 1.274252 -3.392 0.000693 *** IM 1.246937 0.513342 2.429 0.015138 * HYPLIP 1.126383 0.333971 3.373 0.000744 *** SUBSC 0.009521 0.003978 2.393 0.016699 * AGE 0.245182 0.136678 1.794 0.072835 . --- Signif. codes: 0 `***' 0.001 `**' 0.01 `*' 0.05 `.' 0.1 ` ' 1
Risk Factors for Hypertension Interpretation: • HYPERLIPIDEMIA and IM triple odds of ratio • Each three years of AGE double odds of ratio • There is also small, but evincible connection to skinfold above musculus subscapularis (SUBSC)