Download
1 / 38
380 likes | 518 Vues
Relative Cost Efficiency of No-Till Farms. 2008 Ag Profitability Conference: McPherson Michael Langemeier January 15, 2008. Outline of Presentation. Introduction KFMA Data Detailed Cost Comparisons Whole Farm Analysis Summary and Conclusions. Introduction.

E N D
Relative Cost Efficiencyof No-Till Farms • 2008 Ag Profitability Conference: McPherson • Michael Langemeier • January 15, 2008
Outline of Presentation • Introduction • KFMA Data • Detailed Cost Comparisons • Whole Farm Analysis • Summary and Conclusions
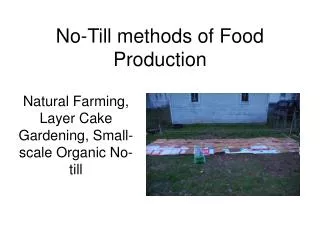
Introduction • Using the 2006 Crop Residue Management Survey, the adoption of no-till production has increased from 7.4% of planted acres in 1990 to 31.5% of planted acres in 2006. • This paper documents cost differences between farms that have adopted a no-till production system, and those with a conventional or reduced tillage system.
KFMA Data • Identification of No-Till Farms • Participating Associations: • Northwest • North Central • South Central • Northeast (Atchison, Jackson, Leavenworth, and Nemaha)
KFMA Data • Detailed Cost Comparisons (2006 data) • North Central • South Central • Whole-Farm Analysis (2002 to 2006 data) • Central Kansas
25 6 5 13 7 46 12 10 3 36 5 9 2 24 7 142 265 8 2 7 1 11 1 8 14 5 4 0 19 5 25 11 27 4 13 5 37 13 31 8 4 1 32 13 13 2 3 0 35 6 31 10 15 8 15 3 40 11 0 0 10 4 22 14 3 0 49 17 30 7 40 9 17 5 1 0 6 0 4 1 18 4 27 8 6 1 29 11 12 2 23 4 25 4 31 9 0 0 0 0 1 0 15 4 7 0 49 12 31 12 0 0 77 15 32 14 68 26 22 4 27 3 24 8 20 5 8 0 8 2 40 15 21 12 23 8 19 10 8 4 77 11 8 0 27 19 47 25 29 10 35 6 22 10 36 16 53 20 55 35 36 5 1 0 2 0 15 14 36 18 0 0 14 4 39 13 21 5 29 13 4 2 51 7 3 1 13 5 12 0 40 10 15 2 0 0 0 0 20 3 33 5 34 15 49 12 16 7 Kansas Farm Management Associations 2006 Membership Top Number = Number of Farm Units Per County Bottom Number = Number of Extra Partners or Persons in the Multi-Operator Farm Units
Detailed Cost ComparisonsPer Harvested Acre • Labor • Hired labor and opportunity charges on operator and family labor • Machinery • Repairs on machinery and equipment, machine hire, gas, fuel, oil, and depreciation on machinery and equipment • Crop • Seed, crop insurance, fertilizer, herbicide, and miscellaneous costs such as irrigation energy, crop storage and marketing, and crop supplies • Improvement • Asset Charges • Other Expenses
Detailed Cost AnalysisCentral Kansas • Labor cost, machinery cost, and asset charges are relatively lower for the no-till farms. • Crop cost is relatively higher for the no-till farms.
Whole-Farm AnalysisCentral Kansas • Comparison of Whole-Farm Characteristics • Total Acres • Crop Acres • Crop Intensity (Harvested Acres/Crop Acres) • Percent of Crop Acres Planted to Wheat, Feed Grains, and Oilseeds
Whole-Farm AnalysisCentral Kansas • Comparison of Whole-Farm Characteristics • Value of Farm Production • Net Farm Income • Labor Cost as a Percent of Value of Farm Production • Value of Farm Production per Worker • Expense Ratios • Operating Profit Margin • Asset Turnover Ratio
Whole-Farm AnalysisDefinitions • Value of Farm Production • Value of farm production (VFP) equals the sum of livestock, crop, and other income computed on an accrual basis minus accrual feed purchased. VFP provides a measurement of value added and if often used as a measure of farm size. • Net Farm Income • Return to operator’s labor, management, and equity (net worth) computed on an accrual basis.
Whole-Farm AnalysisDefinitions • Expense Ratios • Total Expense Ratio • Total Expense / Value of Farm Production • Adjusted Total Expense Ratio • (Total Expense + Opportunity Charge on Operator and Family Labor) / Value of Farm Production • Economic Total Expense Ratio • (Total Expense + Opportunity Charge on Operator and Family Labor + Opportunity Charge on Owned Assets) / Value of Farm Production
Whole-Farm AnalysisDefinitions • Operating Profit Margin Ratio • (Net Farm Income + Interest – Opportunity Charge on Operator and Family Labor) / Value of Farm Production • Asset Turnover Ratio • Value of Farm Production / Average Total Assets
Expense Ratios • Percent of Farms with ETER < 1 • Tillage Farms 19.2% • No-Till Farms 24.5%
Size Versus Adoption of No-Till? • Correlation Coefficients • ETER and Total Acres -0.143 • ETER and Value of Farm Production -0.292 • ETER and Number of Workers -0.119 • ETER and No-Till -0.110 • Both size and NT adoption are significantly correlated with the economic total expense ratio (ETER).
Economies of Size • Significant economies of size exist among KFMA farms. • The profit margin for large farms is substantially higher. • The economic total expense ratio, one of best indicators of economies of size, is substantially lower for large farms.
Performance Benchmarks • KFMA Farms with Continuous Data • 1,160 Farms • 2002 to 2006 • 5-Year Averages: • VFP = $259,095 • Expense Ratios: • Total Expense Ratio = 0.803 • Adjusted Total Expense Ratio = 0.967 • Economic Total Expense Ratio = 1.156 • Operating Profit Margin = 0.0940 • Asset Turnover Ratio = 0.2942
Summary and Conclusions • Cost per harvested acre is relatively lower for farms that have adopted a no-till system. • In addition to having a relatively lower cost per harvested acre, on average, the no-till farms exhibited a lower economic total expense ratio, improved labor efficiency indices, and higher operating profit margin and asset turnover ratios. • However, it is important to note that some of the no-till farms were in the bottom operating profit margin quartile and that some of the mixed tillage farms were in the top operating profit margin quartile.
Contact Information • Publications and Data: • www.agmanager.info • www.kmar105.com • E-mail: • mlange@agecon.ksu.edu