Evaluating Interactive Interfaces: Usability Testing and Assessment Strategies
This lecture by Marti Hearst explores the critical importance of evaluating interactive interfaces in order to understand their usability. Key topics include different types of evaluations such as expert reviews, usability testing, and controlled psychological experiments. Hearst discusses the selection of representative participants, the ethical considerations in testing, and the significance of task selection. The goal is to improve user experience by gathering insightful data and making iterative design adjustments. Understanding how users interact with technology is fundamental to enhancing interface performance.

Evaluating Interactive Interfaces: Usability Testing and Assessment Strategies
E N D
Presentation Transcript
SIMS 247 Lecture 11Evaluating Interactive Interfaces February 24, 1998 Marti Hearst SIMS 247
Many slides from this lecture are closely derived from some created by Professor James Landay, 1997Also, from Chapter 4 of Shneiderman 97 Marti Hearst SIMS 247
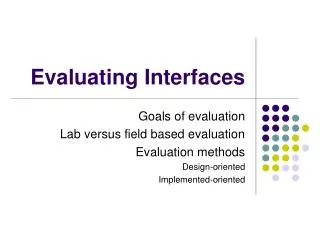
Outline • Why do evaluation? • What types of evaluations? • Choosing participants • Designing the test • Collecting data • Analyzing the data • Drawing conclusions Marti Hearst SIMS 247
Why do Evaluation? • To tell how good or bad a visualization is • People must use it to evaluate it • Must compare against the status quo • Something that looks useful to the designer might be too complex or superfluous for real users • For iterative design • Interface might be almost right but require adjustments • The interactive components might have problems • To advance our knowledge of how people understand and use technology Marti Hearst SIMS 247
Types of Evaluation • Expert Reviews • Usability Testing • Controlled Psychologically-Oriented Experiments • There are tradeoffs for each • see McGrath paper Marti Hearst SIMS 247
Types of Evaluation • Expert Reviews • Heuristic Evaluation • An expert critiques the design with respect to certain performance criteria • Cognitive Walkthrough • Make a low-fidelity prototype • Designers “walk through” or simulate what how a user would use the design under various circumstances • Relies on relevance of experts’ opinions (as opposed to what users experience) Marti Hearst SIMS 247
Types of Evaluation • Usability Testing • Goals • Rapid assessment with real users • Find problems with the design • Techniques • Carefuly chosen set of tasks • Only a few participants (as opposed to a scientific experiment) • Results • Recommended changes • (as opposed to acceptance or rejection of hypothesis) Marti Hearst SIMS 247
Types of Evaluation • Techniques for Usability Testing • “Thinking Aloud” while using the system • Acceptance Tests • Does the interface meet the performance objectives? • Time for users to learn specific functions • Speed of task performance • Rate of errors • User retention of commands over time • Surveys • Focus group discussions • Field Tests Marti Hearst SIMS 247
Types of Evaluation • Controlled Psychologically-Oriented Experiments • Usually part of a theoretical framework • Propose a testable hypothesis • Identify a small number of independent variables to manipulate • Choose the dependent variables to measure • Judiciously choose participants • Control for biasing factors • Apply statistical methods to data analysis • Place results within the theory, or refine or refute the theory if necessary, point direction to future work Marti Hearst SIMS 247
Choosing Participants • Should be representative of eventual users, in terms of • job-specific vocabulary / knowledge • tasks • If you can’t get real users, get approximation • system intended for doctors • get medical students • system intended for electrical engineers • get engineering students • Use incentives to get participants Marti Hearst SIMS 247
Ethical Considerations • Sometimes tests can be distressing • users leave in tears • users can be embarrassed by mistakes • You have a responsibility to alleviate this • make voluntary • use informed consent • avoid pressure to participate • let them know they can stop at any time • stress that you are testing the system, not them • make collected data as anonymous as possible • Often must get human subjects approval Marti Hearst SIMS 247
User Study Proposal • A report that contains • objective • description of system being testing • task environment & materials • participants • methodology • tasks • test measures • Get approved • Once this is done, it is useful for writing the final report Marti Hearst SIMS 247
Selecting Tasks • Should reflect what real tasks will be like • may need to shorten if • they take too long • require background that test user won’t have • Be sure tasks measure something directly related to your design • But don’t bias the tasks so that only your design can win • should be a realistic task in order to avoid this • Don’t choose tasks that are too fragmented Marti Hearst SIMS 247
Special Considerations for Evaluating Visualizations • Be careful about what is being compared • Example of how to do it wrong: • One study compared a web path history visualization that had • thumbnails • fisheye properties • hierarchical layout • against the Netscape textual history list • Problem: • too many variables changed at once! • can’t tell which of the novel properties caused the effects Marti Hearst SIMS 247
Important Factors • Novices vs. Experts • often no effect is found for experts, or experts are slowed down at the same time that novices are helped • experts might know the domain while novices do not • need to try to separate learning about the domain from learning about the visualization Marti Hearst SIMS 247
Important Factors • Perceptual abilities • spatial abilities tests • colorblindness • handedness (lefthanded vs. righthanded) Marti Hearst SIMS 247
The “Thinking Aloud” Method • This is for usability testing, not formal experiments • Need to know what users are thinking, not just what they are doing • Ask users to talk while performing tasks • tell us what they are thinking • tell us what they are trying to do • tell us questions that arise as they work • tell us things they read • Make a recording or take good notes • make sure you can tell what they were doing Marti Hearst SIMS 247
Thinking Aloud (cont.) • Prompt the user to keep talking • “tell me what you are thinking” • Only help on things you have pre-decided • keep track of anything you do give help on • Recording • use a digital watch/clock • take notes • keep a computerized log of what actions taken • if possible • record audio and video Marti Hearst SIMS 247
Pilot Study • Goal: • help fix problems with the study • make sure you are measuring what you mean to be • Procedure: • do twice, • first with colleagues • then with real users • usually end up making changes both times Marti Hearst SIMS 247
Instructions to Participants (Gomoll 90) • Describe the purpose of the evaluation • “I’m testing the product; I’m not testing you” • Tell them they can quit at any time • Demonstrate the equipment • Explain how to think aloud • Explain that you will not provide help • Describe the task • give written instructions Marti Hearst SIMS 247
Designing the Experiment • Reducing variability • recruit test users with similar background • brief users to bring them to common level • perform the test the same way every time • don’t help some more than others (plan in advance) • make instructions clear • control for outside factors • Evaluating an interface that uses web hyperlinks can cause problems • variability in network traffic can effect results • participants should be run under as similar conditions as possible • try to eliminate outside interruptions Marti Hearst SIMS 247
B A Comparing Two Alternatives • Between groups experiment • two groups of test users • each group uses only 1 of the systems • Within groups experiment • one group of test users • each person uses both systems • can’t use the same tasks (learning effects) • See if differences are statistically significant • assumes normal distribution & same std. dev. Marti Hearst SIMS 247
Experimental Details • Order of tasks • between groups • choose one simple order (simple -> complex) • within groups • must vary the ordering to make sure there are no effects based on the order in which the tasks occurred • Training • depends on how the real system will be used • What if someone doesn’t finish • assign very large time & large # of errors Marti Hearst SIMS 247
Measurements • Attributes that are useful to measure • time requirements for task completion • successful task completion • compare two designs on speed or # of errors • application-specific measures • e.g., how many web pages visited • Time is easy to record • Error or successful completion is harder • define in advance what these mean Marti Hearst SIMS 247
Measuring User Preference • How much users like or dislike the system • can ask them to rate on a scale of 1 to 10 • or have them choose among statements • “this visualization helped me with the problem…”, • hard to be sure what data will mean • novelty of UI, feelings, not realistic setting, etc. • If many give you low ratings, you are in trouble • Can get some useful data by asking • what they liked, disliked, where they had trouble, best part, worst part, etc. (redundant questions) Marti Hearst SIMS 247
Debriefing Participants • Interview the participants at the end of the study • Ask structured questions • Ask general open-ended questions about the interface • Subjects often don’t remember details • video segments can help with this • Ask for comments on specific features • show them screen (online or on paper) and then ask questions Marti Hearst SIMS 247
Analyzing the Numbers • Example: trying to get task time <=30 min. • test gives: 20, 15, 40, 90, 10, 5 • mean (average) = 30 • median (middle) = 17.5 • looks good! • wrong answer, not certain of anything • Factors contributing to our uncertainty • small number of test users (n = 6) • results are very variable (standard deviation = 32) • std. dev. measures dispersal from the mean Marti Hearst SIMS 247
Analyzing the Numbers (cont.) • This is what statistics are for • Get statistics book • Landay recommends (for undergrads) • The Cartoon Guide to Statistics, Gonick and Smith • Crank through the procedures and you find • 95% certain that typical value is between 5 & 55 • Usability test data is quite variable • Need many subjects to get good estimates of typical values • 4 times as many tests will only narrow range by 2 times • breadth of range depends on sqrt of # of test users Marti Hearst SIMS 247
Analyzing the Data • Summarize the data • make a list of all critical incidents (CI) • positive: something they liked or worked well • negative: difficulties with the UI • include references back to original data • try to judge why each difficulty occurred • What does data tell you? • Does the visualization work the way you thought it would? • Is something missing? Marti Hearst SIMS 247
Using the Results • For usability testing: • Update task analysis and rethink design • rate severity & ease of fixing CIs • fix both severe problems & make the easy fixes • Will thinking aloud give the right answers? • not always • if you ask a question, people will always give an answer, even it is has nothing to do with the facts • try to avoid specific questions Marti Hearst SIMS 247
Study Good Examples of Experiments! • Papers in reader • by Byrne on Icons • Studies done by Shneiderman’s students • www.otal.umd.edu/Olive/Class Marti Hearst SIMS 247
Byrne Icon Study • Question: do icons facilitate searching for objects in a graphical UI? • Do they work better than lists of file names? • What characteristics of icons work best? Marti Hearst SIMS 247
Byrne Icon Study • A Task Analysis (of how icons are used) identified three kinds of factors: • General factors • Visual search factors • Semantic search factors • Twelve factors, all told • Only a subset will be investigated Marti Hearst SIMS 247
Byrne Icon Study • Theoretical Model: • Model of Mixed Search • Icon search involves two kinds of search that may or may not be related • the icon picture • the textual name associated with it • This leads to two kinds of search that get mixed together • visual search • semantic search • The visual characteristics of the icon will partly determine visual search time Marti Hearst SIMS 247
Byrne Icon Study • Goals of experiment are two-fold • estimate effects of several of the factors • evaluate the Mixed Search model • Mixed search model depends on timing for visual search, so vary parameters relating to visual search: • vary complexity of visual form of icons • vary icon set size • color kept constant • Model also depends on association of meaning with icons, so vary type of knowledge needed: • file name knowledge • picture knowledge Marti Hearst SIMS 247
Byrne Icon Study • Method • Participants • 45 undergrads getting extra credit in a course • note this will probably allow for statistical significance • Materials • instructions and stimuli presented in hypercard • Design of Experiment • Complex: • one factor evaluated between subjects • icon type, one of three levels • four factors evaluated within subjects • set size of icons • match level varied within sizes • amount of a priori picture knowledge • amount of a priori filename knowledge Marti Hearst SIMS 247
Byrne Icon Study • Procedures and Stimuli • Participants got 3 practice runs and 72 experimental runs • Each run had three stages • encoding (see the target document) • decay (do something else to distract) • search (find the correct icon as quickly as possible) Marti Hearst SIMS 247
Byrne Icon Study • Some Results • Mean across all conditions was 4.36 seconds with a standard deviation of 6.61s • Outliers discarded • No overall effect for icon type • But interactions occurred • The search time was effected by a combination of the picture knowledge and icon type • participants could only make use of the meaning of the picture if the meaning was displayed in a simple way Marti Hearst SIMS 247
Byrne Icon Study • More Results • The search time was effected by a combination of filename knowledge and icon type • participants did best with blank icon if they knew the filename! • If the did not know the filename, participants did best with the simple icon • Simple icons were faster to search on overall • compared against a baseline of blank icons Marti Hearst SIMS 247
Byrne Icon Study • Conclusions • For icons to be effective aids in visual search • they should be simple • they should be easily discriminable from one another • simple icons • more effective for large set sizes • allow user to use knowledge of picture meaning • are less effected by lack of filename knowledge • complex icons • are worse than blank! • Support found for the mixed search two-pass processing model Marti Hearst SIMS 247
Summary • User evaluation is important, but takes time & effort • Early testing can be done on a mock-ups (low-fi) • Use real tasks & representative participants • Be ethical & treat your participants well • Goal: learn what people are doing & why • Doing scientific experiments requires more users to get statistically reliable results Marti Hearst SIMS 247