Download
1 / 38
380 likes | 642 Vues
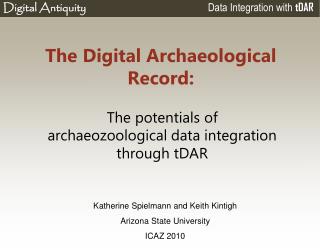
The Digital Archaeological Record:. The potentials of archaeozoological data integration through tDAR. Katherine Spielmann and Keith Kintigh Arizona State University ICAZ 2010. the Digital Archaeological Record,.

E N D
The Digital Archaeological Record: The potentials of archaeozoological data integration through tDAR Katherine Spielmann and Keith Kintigh Arizona State University ICAZ 2010
the Digital Archaeological Record, . • Web-based ingest interface: user/contributors upload data and detailed metadata • Provides long-term preservation of data & metadata • Web-based discoveryand access for data and documents produced by archaeological projects. • Provide data integration across inconsistent databases
A Bit of History • Driven by need for synthetic research • Genesis of the project (1999) was a long-term collaboration of ASU archaeologists • Frustrated by the difficulty of • Obtaining data • Integrating data that were collected using different coding schemes by different investigators • Teamed up with computer scientists and got funding
Additional Metadata • Collection Procedures: • Sampling of site • Sampling of bone assemblage • Screen size • Context (room, trash, hearth, pit) • Quality of faunal collection • Weathering • % identifiable
Preserve the original data in original format in a sustainable format (that can be migrated) on sustainable media no transformations of original file’s content users can always download the data as recorded Preserve database semantics through collection and dissemination of metadata Ensure users’ attribution of credit to creators
Ontologies • Ontology is a map of the semantic relationships among a set of concepts. • In tDAR, ontologies are ordinarily hierarchical (tree-like) and represent an arbitrary number of levels of class-subclass relationships
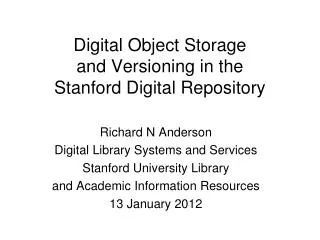
Burning Intensity First Level Second Level Unburned Probably Burned Burned Indeter-minate Not Recorded Calcined Charred Singed
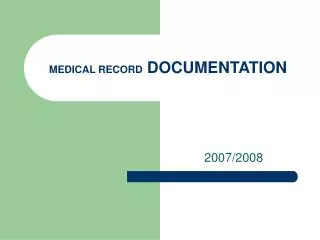
Butchering First Level Second Level Not Butchered Probably Butchered Butchered Indeter-minate Not Recorded Cut Marks Saw Marks Chop Marks
Ontology Mapping • For a variable to be integrated across databases: • The values for that variable in each database are mapped to appropriate nodes in the ontology tree • Mapping preferably done by the original analyst
Ontology Mapping - Example • Database 1 • Database has taxon value 107 • Its coding sheet says taxon 107 = “hare” • Database 2 • Database has taxon value 237 • Coding sheet says 237 = “black-tailed jackrabbit” described as “Lepus californicus”
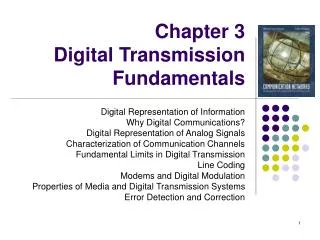
Map Coding Key to Ontology Upper Little Colorado Prehistory Project Pueblo Blanco
Zuni Salinas
tDAR Integration • User queries tDAR to identify databases • Mark databases to go in user workspace • Select tables to integrate
Output • Output Database • observations from both datasets • integration uses common ontology values • filtering eliminates cases • aggregation for consistency and analytical simplicity • Database is downloaded and analyzed by user.
Resource Depression/Overhunting • How recognize? • Changing prey abundances • % NISP of large and small taxa • index ratios of large versus small taxa • Is small game anthropogenic • Burning
Change in prey demographics • Age of prey • Fusion • Change in element frequencies of large game (transport) • FUI • Increased processing of large game • Condition (% complete) • Weight
Acknowledgments • Andrew W. Mellon Foundation • National Science Foundation • National Endowment for the Humanities • UK Joint Information Systems Committee • Archaeology Data Service, University of York • Digital Antiquity Board of Directors Sander van der Leeuw, Arizona State University (ASU) [chair] Carol Ackerson, Girl Scouts Arizona Cactus-Pine Council Jeffrey Altschul, SRI Foundation Kim Bullerdick, Owner, BI, L.L.C. John Howard, University College, Dublin Keith Kintigh, ASU Tim Kohler, Washington State University Fred Limp, University of Arkansas Harry Papp, L. Roy Papp & Associates Julian Richards, University of York Dean Snow, The Pennsylvania State University