Download
1 / 25
340 likes | 751 Vues
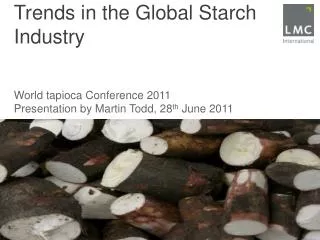
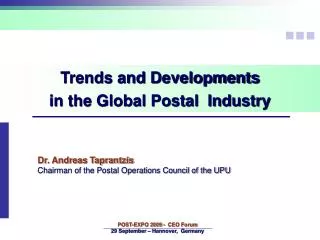
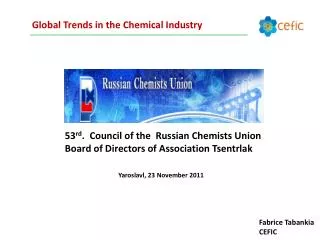
Global Trends in the Chemical Industry. 53 rd . Council of the Russian Chemists Union Board of Directors of Association Tsentrlak Yaroslavl, 23 November 2011 . Fabrice Tabankia CEFIC. Global Chemical Industry. Global Chemicals Sales in 2010. 2353 Billion €.

E N D
Global Trends in the Chemical Industry 53rd. Council of the Russian Chemists Union Board of Directors of Association Tsentrlak Yaroslavl, 23 November 2011 FabriceTabankia CEFIC
Global Chemicals Sales in 2010 2353 Billion €
EU Chemicals Industry: Highest Added-Value per Employee Chemical industry-the leading EU manufacturing sector in terms of value-added per employee
Rest of Europe 24.4 37.4 NAFTA 23.8 Asia* 20.3 35.0 28.3 China Japan 10 6.1 6.7 8.7 Africa 3.1 Rest of World 9.5 2.7 6.4 Trade Balance: € 47 billion in 2010 EU chemicals trade flows in € billion: 2010 EU27 LAC** 4.0 9.4 * excludes Japan & China **Latin America and the Caribbean Source: Cefic Chemdata International
CEFIC Council of the European Chemical Industry
This is Cefic Since its creation in 1972, Cefic has grown to become one of the largest industry trade organizations in Europe and in the world • Representing 29.000 chemical companies in Europe • 28 National Chemical Federations across Europe • Over 600 direct Company Members from Europe • More than 30 Associate Company Members from around the world • 40 Partner Companies & Associations • 23 European Affiliated Associations • Operates 101 Sector Groups focusing on 120+ product families and over 60 Strategy • implementation and Issue Teams dealing with the industry’s horizontal issues (REACH, • International Trade, Energy & Climate change, Research & Innovation, …) • About 5000 industry experts from companies and federations participate in the Cefic groups • Close cooperation with the other regions in the world through ICCA
Cefic Priorities 2011 Competitiveness Sustainable development Chemicals safety Organisational • - Exploit synergies with Affiliates, • National Federations • HR policy review
Conclusion • More innovation and research: Strengthen innovation networks, increase quality and effectiveness of R&D • Smart regulation takes the competitiveness of industry into account • Level playing field for sourcing energy and feedstock • Open markets with fair competition ASustainable and Competitive EU ChemicalIndustryrequires:
CEPE The European Council of Paint and Printing Ink producers
CEPE represents in the EU 27 Approx. 900 paint manufacturers 75 pr. ink manufacturers 20 artists’ colours manufacturers Directly employed: 110.000 employees Member Companies; multinationals and SMEs This represents approx. 80 % of market
Demand by European Country Central & Eastern Europe now make up over one-fourth of the European market.
End-Use Segments Decorative coatings comprise the largest single component of the market. Only General Industrial, at 13%, accounts for over 10% of the total market.
The Printing Ink Market 6% 11% 13% 13% 36% 45% 36% 40%
The main EU legislative issues that impact paints and inks from formulating up till waste. Formulating VOCs Biocides R E A C H Labelling CLP Transport Applying product FoodPack In use of cured (dried) product Biocides IndoorAir After use + waste
Thank You ! Pleasevisitwww.cefic.org for more information