
Introduction
Texas A & M University Department of Civil Engineering CVEN689 Applications of GIS to Civil Engineering Instructor: Dr. Francisco Olivera Application of GIS to Bridge Health Monitoring By: Mohammed Safi Uddin Adil 05/01/2004. Introduction

Introduction
E N D
Presentation Transcript
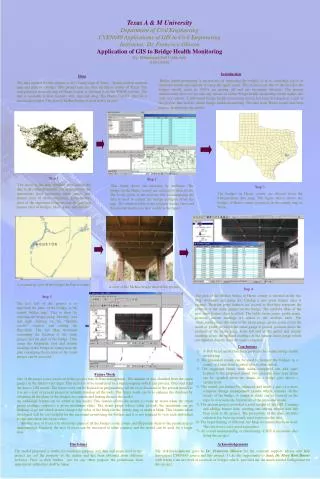
Texas A & M UniversityDepartment of Civil EngineeringCVEN689 Applications of GIS to Civil EngineeringInstructor: Dr. Francisco OliveraApplication of GIS to Bridge Health MonitoringBy: Mohammed Safi Uddin Adil05/01/2004 Introduction Bridge health monitoring is the practice of inspecting the bridges so as to constantly assess its structural health and capacity to carry the apply loads. This is necessary due to the fact that the bridges mostly made in 1960’s are getting old and are becoming deficient. The present infrastructure does not provide any means of online bridge health monitoring which makes this task very tedious. A GIS based bridge health monitoring system has been developed as a part of this project that enables online bridge health monitoring. The data from Harris county has been used to demonstrate the model. Data The data needed for this project is the County map of Texas, Transportation network map and plan of a bridge. This project uses the data for Harris county of Texas. The transportation network map of Harris county is obtained from the TNRIS website. The data is available in three formats .e00, .dgn and .dwg. The Harris TxDOT .dgn file is used in the project. The plan of McKee bridge is used in this project. Step 1 The above is the map obtained after adding the data to Arc Map document. The map contains the annotations layer containing street names, line feature class of street centerlines, point feature class of the important locations and the polygon feature class of bridges, lakes, dams, culverts etc. Step 2 This figure shows the selection by attributes. The bridge sin the Harris county are selected by their levels. The levels given in the read me file accompanying the data is used to extract the bridge polygons from the map. The attribute table of the polygon feature class and the selected feature are also visible in the figure Step 3 The bridges in Harris county are filtered from the transportation data map. The figure above shows the bridges in Harris county projected on the county map of Texas A zoomed in view of the bridges in Harris county A view of the McKee bridge used in the project Step 4 The plan of the McKee bridge in Harris county is inserted in the Arc Map document and using Arc Catalog a new point feature class is created. Then the point features are created so that they represent the position of the strain gauges on the bridge. The attribute table of the new point feature class is edited. The fields strain_name, girder_name, position, current readings are added to the attribute table. The strain_name stores the name of the strain gauge, girder_name stores the name of girder on which the strain gauge is placed, position stores the position of the strain gauge from left end of the girder and current readings stores the updated readings of the current strain gauge which are inputted directly from the super computer. Step 5 The last task of the project is to hyperlink the plans of the bridges to the county bridge map. This is done by selecting the bridge using “Identify” tool and right clicking on the “Identify results” window and adding the Hyperlink. The Arc Map document containing the location of the strain gauges and the plan of the bridge. Then using the Hyperlink tool and double clicking on the bridge in county map the plan containing the location of the strain gauges can be accessed. • Conclusions • A GIS based model has been proposed for online bridge health monitoring. • 2) The presented model can be used to monitor the bridges in a county at a time from a central observation station. • 3) The suggested future work when completed can add some features to the proposed model. For example some type alarm can be signaled when the strains in a bridge goes above a certain level. • 4) The model can further be enhanced and made a part of a more complete Bridge management system which includes all the details of the bridge. A complete study can be focused on the topic to overcome the limitations of the presented model. • 5) The present project provided a good insight of the GIS. Creating and editing feature data, creating and editing tabular data has been used in the project. The projections of the data, attribute selection has been rigorously used to process the data. • 6) The hyper linking of different Arc Map documents has been used. This has been a very good experience. • 7) An overall understanding of functioning of GIS is increased after doing this project. Future Work One of the major issues involved in this project was of Data management. The amount of data obtained from the strain gauges in the field is very huge. This data has to be transferred to a supercomputer which can process, filter and send the data to GIS model. The future work can be focused on programming all the tools discussed in the present model as it is not a part of present project to actually develop all the tools. The future work can be to enhance the database by obtaining all the plans of the bridges in counties and linking them to the model. An additional feature can be added to this model. This feature allows the model to create an alarm when the strain gauge readings surpasses a given maximum value. The strain gauge whose value exceeds the maximum can go blinking or go red which in turn changes the color of the bridge in the county map or make it blink. This feature when developed will be very helpful for the personnel monitoring the bridges and it is not required to visit each individual bridge and check the strain values. Another area of focus is to obtain the plans of all the bridges in the county and Hyperlink them to the parent map as demonstrated. Similarly the area of focus can be increased to other counties and the model can be used for a larger area. Disclaimer The model proposed is totally for academic purpose and data and maps used in this project are not the property of the author and has been obtained from different websites. Prior to their further use for any other purpose the permission from appropriate authorities shall be taken. Acknowledgements My Acknowledgments goes to Dr. Francisco Olivera for his constant support, advice and help throughout CVEN689 course and this project. I take this opportunity to thank Dr. Mary Beth Huestewith whom I am involved in research on bridges which provided me the much needed background for this project.


