Download
1 / 32
320 likes | 500 Vues
School of Public Health. Sample Size Estimation Incorporating Disease Progression. Barbara C. Tilley, Ph.D. Keith Burau, Ph.D. University of Texas, School of Public Health Jordan Elm, Ph.D. Medical University of South Carolina. Acknowledgment. This presentation is based on:

E N D
School of Public Health Sample Size Estimation Incorporating Disease Progression Barbara C. Tilley, Ph.D. Keith Burau, Ph.D. University of Texas, School of Public Health Jordan Elm, Ph.D. Medical University of South Carolina
Acknowledgment This presentation is based on: Guimaraes P, Kieburtz K, Goetz CG, Elm JJ, Palesch Y, Huang P, Ravina B, Tanner CM, Tilley BC. Non-linearity of Parkinson’s disease progression: implications for sample size calculations in clinical trials. Clinical Trials 2005; 2:509-518
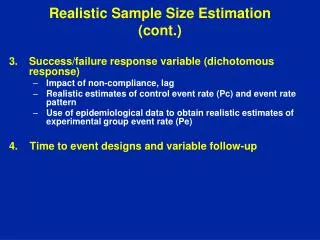
Parkinson’s Disease (PD) Issues • Many short term studies enroll untreated (de novo) patients. • De novo patients are followed to dopaminergic therapy and LOCF is used, or to study end point, whichever occurs first. • Once a patient starts dopaminergic therapy there is a decrease in the manifestions of PD.
UPDRS scores • The gold standard PD rating scale • Measures combine questions on Motor, ADL, mental function • Purpose of Guimaraes et al’s approach was to characterize progression of UPDRS scores after initiation of symptomatic therapy
Evolution of UPDRS Scores UPDRS Scores Start Sx Tx 3 - 6 months 5 yearsTime
Long Term Follow-up of UPDRS scores with Different Study Populations UPDRS Scores Baseline End of Study STUDY TIME
Sample Size Estimation • Based on data from other PD clinical trials (CALM-PD and GSK) we developed a non-linear model of the symptomatic effect of antiparkinsonian medications on disease progression as measured by UPDRS scores. • We used the model to: • Predict change in Total UPDRS; • Predict the variance (s.d.) associated with change in Total UPDRS; • To infer sample size
Non-linear Model Yi(t) = b0i + b1it - b2i (1-eb3t) + it • The model assumes that scores reflect the sum of two components: • A linear trend reflecting disease progression • A symptomatic effect that “wears-off” over time Si(t)=b2i (1-eb3t)
BASELINE = Initiation of LevodopaEstimated Changes in Total UPDRS(Based on CALM-PD data) * 30% or 3 points change in UPDRS over over 1 yr = success
BASELINE = Initiation of LevodopaSample-Size Requirements(Based on CALM-PD data)* * Assumes actual value used, not LOCF
BASELINE = 6 months after LevodopaEstimated Changes in Total UPDRS(Based on CALM-PD data)
BASELINE = 6 months after LevodopaSample-Size Requirements(Based on CALM-PD data)* * Assumes actual value used, not LOCF.
Another Issue in PD • Reduction in time from diagnosis to initiation of antiparkinson/dopaminergic therapy (due to clinical practice) is adding to difficulty of studying untreated (de novo) patients
Kaplan-Meier curve of time from diagnosis to need for symptomatic therapy.
Sample Size for NET-PD LS-1 • Objective: Determine if there is > 1 year * difference in slowing of clinical decline over 5-year period comparing creatine treated participants to placebo treated participants. • Inclusion: All participants currently on dopaminergics drugs at least 90 days but < 2 years *1.5 years for ambulatory capacity
Sample Size • Calculations based on data collected in other studies for patients on dopaminergic treatment at least 90 days. • Clinical decline: change from baseline* over 5 years using a combination of 5 cognitive, physical, and quality of life measures combined into a single outcome and compared with a global statistical test (O’Brien Ranked Test). * Rankin – final value
Improvement in Long Term Progression • Ambulatory capacity • Modified Rankin (functional disability scale) • PDQ-39 (Quality of Life) • Schwab and England (ADL scale) • Symbol Digit Modalities (measure of cognitive impairment) • Global Statistical Test of • Ambulatory capacity (5 UPDRS Questions)* • Modified Rankin (functional disability scale) • PDQ-39 (Quality of Life) • Schwab and England (ADL scale) • Symbol Digit Modalities (measure of cognitive impairment) • *Target of dopaminergic medications
LS-1 Sample Size (cont) • N= 860 per group • Power > 85% to detect a 1-1.5 year slowing of clinical decline in the treatment arm compared to control • Chose largest sample size for a single outcome • alpha = 0.05, 2-sided. • Adjusted for 20% drop-ins and drop-outs with inflation factor • Overall GST gives > 90% power
Considerations in Long Term Study • Avoids using short term LOCF value for long term outcome • Avoids non-linearity issue identified by Guimaraes. • Objective is improvement in long-term clinical decline rather than distinguishing symptomatic from disease modification effects • Expected to take at least 5 years to see changes in outcomes other than UPDRS.
Delayed Start Design for Chronic Disease Phase 1 Phase 2 Disease Mod. Effect A P A A 0 T1 T2 T3 T4 Time Point Baseline
Delayed Start • Goal to separate symptomatic from disease modifying effects • Provides shorter follow-up on placebo • More assumptions (e.g. duration of symptomatic effect) • Can be affected by non-linearity if de novo patients included. • Sample size implications if placebo goes on treatment
NET-PD FS-Zone Phase II Futility Study of Pioglitazone • Inclusion criteria – on stable dose of either 1 mg/day of rasagiline or 10mg/day of selegiline for 8 months before randomization. • Expected to remain on the fixed dose for the duration of the trial. • Sample size - 72 pt per group to detect a 3 point change in UPDRS, two-sided alpha = 0.15, power = 0.85.
FS-ZONE • Baseline examination roughly coincides with the period in which the patient is experiencing the maximum symptomatic benefit of the concurrent antiparkinson medication. • Thus the nonlinearity characterized by Guimaraes et al 2005 is avoided.
Considerations for Phase II Studies of Shorter Duration Starting de novo patients on antiparkinson therapy before trial will: • Reduce variability • Reduce potential confounding (of other antiparkinsonian meds) • Reduce missing data (patients dropping out to go on other treatments) • Increase likelihood of recruitment.
Alzheimer’s Disease Report of the task force on designing clinical trials in early (predementia) AD (e-Pub ahead of print). Neurology 2011.
Conclusions • Parkinson’s Disease (PD) • Effects of l-dopa and other dopminergic therapies on decline, and course of PD, and Guimaraes model suggest considering the effect of dopaminergic therapy on decline is essential in the design, at least for UPDRS (standard outcome measure).
Conclusions Continued • Early Alzheimer’s Disease • Shares some characteristics of PD in terms of decline • Figure presented does not address introduction of other therapies • Therapies such as Aracept and others that may slow or mask decline may create similar design issues. • It would be useful to model Alzheimer’s data using Guimaraes approach
Conclusions Continued • Rheumatoid Arthritis (RA) • Course of disease more erratic due to flares, remissions • Immediate and long term effects of DMARDs vary • Trials usually require stable dose of prednisone, methotrexate as entry criteria. • More analyses of RA data sets with longer follow-up and stronger DMARDS would be of interest; effects on sample size less likely