Download

1 / 6
60 likes | 177 Vues
This research investigates why undergraduate biology students struggle with creating effective graphical representations of data. The study focuses on first-year biology majors enrolled in introductory laboratory classes and seeks to identify specific difficulties they encounter. Utilizing a mixed-methods approach, the research involves ‘think-aloud’ sessions with both expert faculty and novice students to assess the steps taken in graph creation. By examining student lab notebooks and reports, the study aims to enhance understanding of the communication language in scientific data representation.

E N D
Research Problem – Stephanie Gardner • Students have difficulty in creating appropriate graphical representations for their data Example of raw data (excerpt) Example of student graphical representation
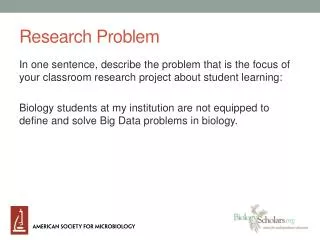
Research Question • Big Research Question: Why do undergraduate Biology students have difficulties creating graphical representations of data? • Subquestion #1 – What is?: What aspects of creating graphical representations are difficult for first-year students? • Research Context: First-year biology majors enrolled in introductory biology laboratory classes and Biology faculty • My question is interesting because: Graphs (and other representations) are an important language that scientists use in communication with each other and the general public.
Research Methodology • Mixed methods approach: • ‘Talk aloud’ during the creation of a graph from a dataset to determine the steps that experts and novices take • Experts: Biology faculty • Novices: Students enrolled in intro biology lab classes (traditional and research-based) • Practical assessment of graph choice • embedded in my class • Evaluation of graphical representations used by students in their lab notebooks and lab reports during the semester • embedded in my class
Alignment of Research Question and Methodology Research question: What aspects of creating graphical representations are difficult for students?
Alignment of Research Question and Methodology Research question: What aspects of creating graphical representations are difficult for students?