Download
1 / 26
310 likes | 824 Vues
NITRIFICATION CONTROL IN THE FLORIDA KEYS. Roy Coley, Director of Operations, Florida Keys Aqueduct Authority, Key West, FL Jolynn Reynolds, Assoc. Engineer for Water Quality, Florida Keys Aqueduct Authority, Key West, FL

E N D
NITRIFICATION CONTROL IN THE FLORIDA KEYS Roy Coley, Director of Operations, Florida Keys Aqueduct Authority, Key West, FL Jolynn Reynolds, Assoc. Engineer for Water Quality, Florida Keys Aqueduct Authority, Key West, FL Cory Johnson, Eastern US Regional Technology Leader, CH2MHILL, Inc., Deerfield Beach, FL
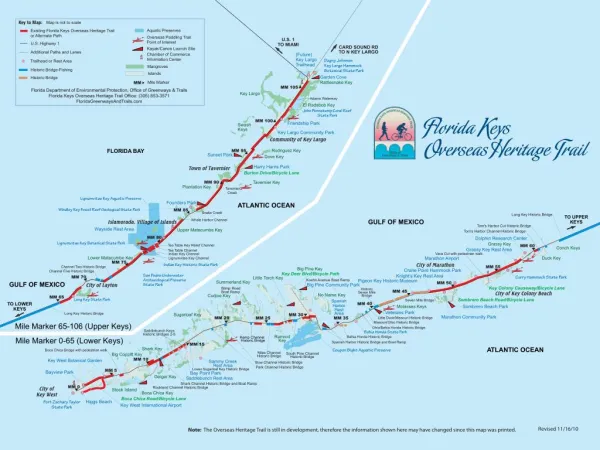
Presentation Outline • Introduction to the Keys • Nitrification Issues for FKAA • Nitrification Overview • “The Event” • Investigation Approach • Data Collection and Analysis • Revised Operational Procedures
5MG 5MG 5MG 5MG
PROBLEMS CAUSED BY NITRIFICATION • Total chlorine residual is reduced • Nitrite and nitrate increase (methemoglobinemia) • Alkalinity and pH are reduced • HPC count increases • Additional water loss to flushing
CAUSES OF NITRIFICATION • Nitrifying bacteria are everywhere. Unbound NH3 serves as the primary substrate for propagation of these nitrifying bacteria. • Excess ammonia added during chloramination or from lower chlorine to ammonia ratio during dosing. • Normal decay of chloramines, primarily due to water age, which releases NH3 into the water. • Chlorine demand which releases NH3 into the water. • Elevated water temperatures • Ideal temperature range for nitrifying bacteria growth 25-30 0C. • Chloramine decomposition rate increases with temperature wherein more free ammonia will be released. • Optimum pH conditions with a range for nitrifying bacteria growth of 7.5 to 8.0; but can occur at PH 6.6 to 9.8.
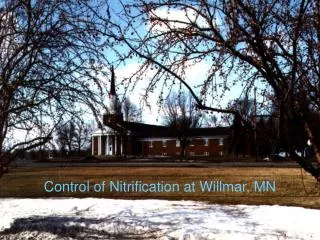
CONDITIONS ARE GOOD FOR NITRIFICATION TO OCCUR IN THE FKAA’S SYSTEM
The Keys’ Unique Distribution Increases Potential for Nitrification • Water Transmission time can exceed 5 days • Water Storage and Distribution time can exceed an additional 5 days • Water temperature ranges between 19°C and 31°C • Presence of free NH3
FLORIDA CITY LS & RO MARATHON RO STOCK ISLAND RO
RESEARCH STRATEGIES & INFRASTRUCTURE IMPROVEMENTS FOR CONTROLLING NITRIFICATION
Approach Outline • Evaluated pH vs. chloramine degradation • Total chlorine • Ammonia • Water quality data collection • Investigated correlations between parameters • Developed operating protocols
FKAA Monitoring, Alert and Action Levels for Primary Nitrification Control Parameters
Monitoring Protocol • Primary parameters analyzed daily at the Florida City WTP, Marathon Booster Pump Station, and Stock Island Pump Station and reported to the Operations Director. • When analytical measurements are in the “Monitoring Only” ranges simply reporting as instructed is all that is required by the various operators. • When analytical measurements are in the “Alert Level” ranges for any primary parameter, reporting as instructed for monitoring only and then verify that the Operations Director is aware of analytical measurements and seek whether or not an action is warranted. • When analytical measurements are in the “Action Level” ranges for any primary parameter, report as in monitoring, and alert levels. Contact Operations director for specific instructions on action(s) to be taken.
Action Protocol • Increase chlorine to ammonia ratio at Florida City WTP to reduce free ammonia levels • Inject chlorine at Marathon pump station to eliminate free ammonia • Inject chlorine at Stock Island pump station to eliminate free ammonia • Increase system flushing to reduce water age • Reduce water storage tank levels to reduce water age • Drain and refill water storage tanks to completely turn over the water in storage • Breakpoint chlorination to eliminate nitrification
Summary and Conclusions • Since conversion to chloramines, the FKAA has been “challenged” by the occurrence of nitrification in the water system. • For FKAA, elevated free ammonia and nitrite were the best predictors of nitrification outbreaks • Free ammonia residuals below 0.1-mg/L minimized nitrification and subsequent nitrite formation. • Other parameters such as total ammonia, nitrate, pH, alkalinity and HPCs were not consistent predictors of nitrification and were considered lagging indicators
Summary and Conclusions • Research, strategies, and infrastructure improvements contributed to the enhancement of the nitrification control plan • FKAA’s has minimized the occurrence of nitrification in the past 4 years • The enhanced protocol may afford an opportunity to experiment with treatment optimization • pH > 9 helps control nitrification • Higher lime dosages to reach pH above 9 which creates additional cost • Next step to investigate operations at pH <9 • Goal for pH to be determined by the Langelier Index rather than the need to control nitrification